Trading Setup Ideas|9/20 23:20
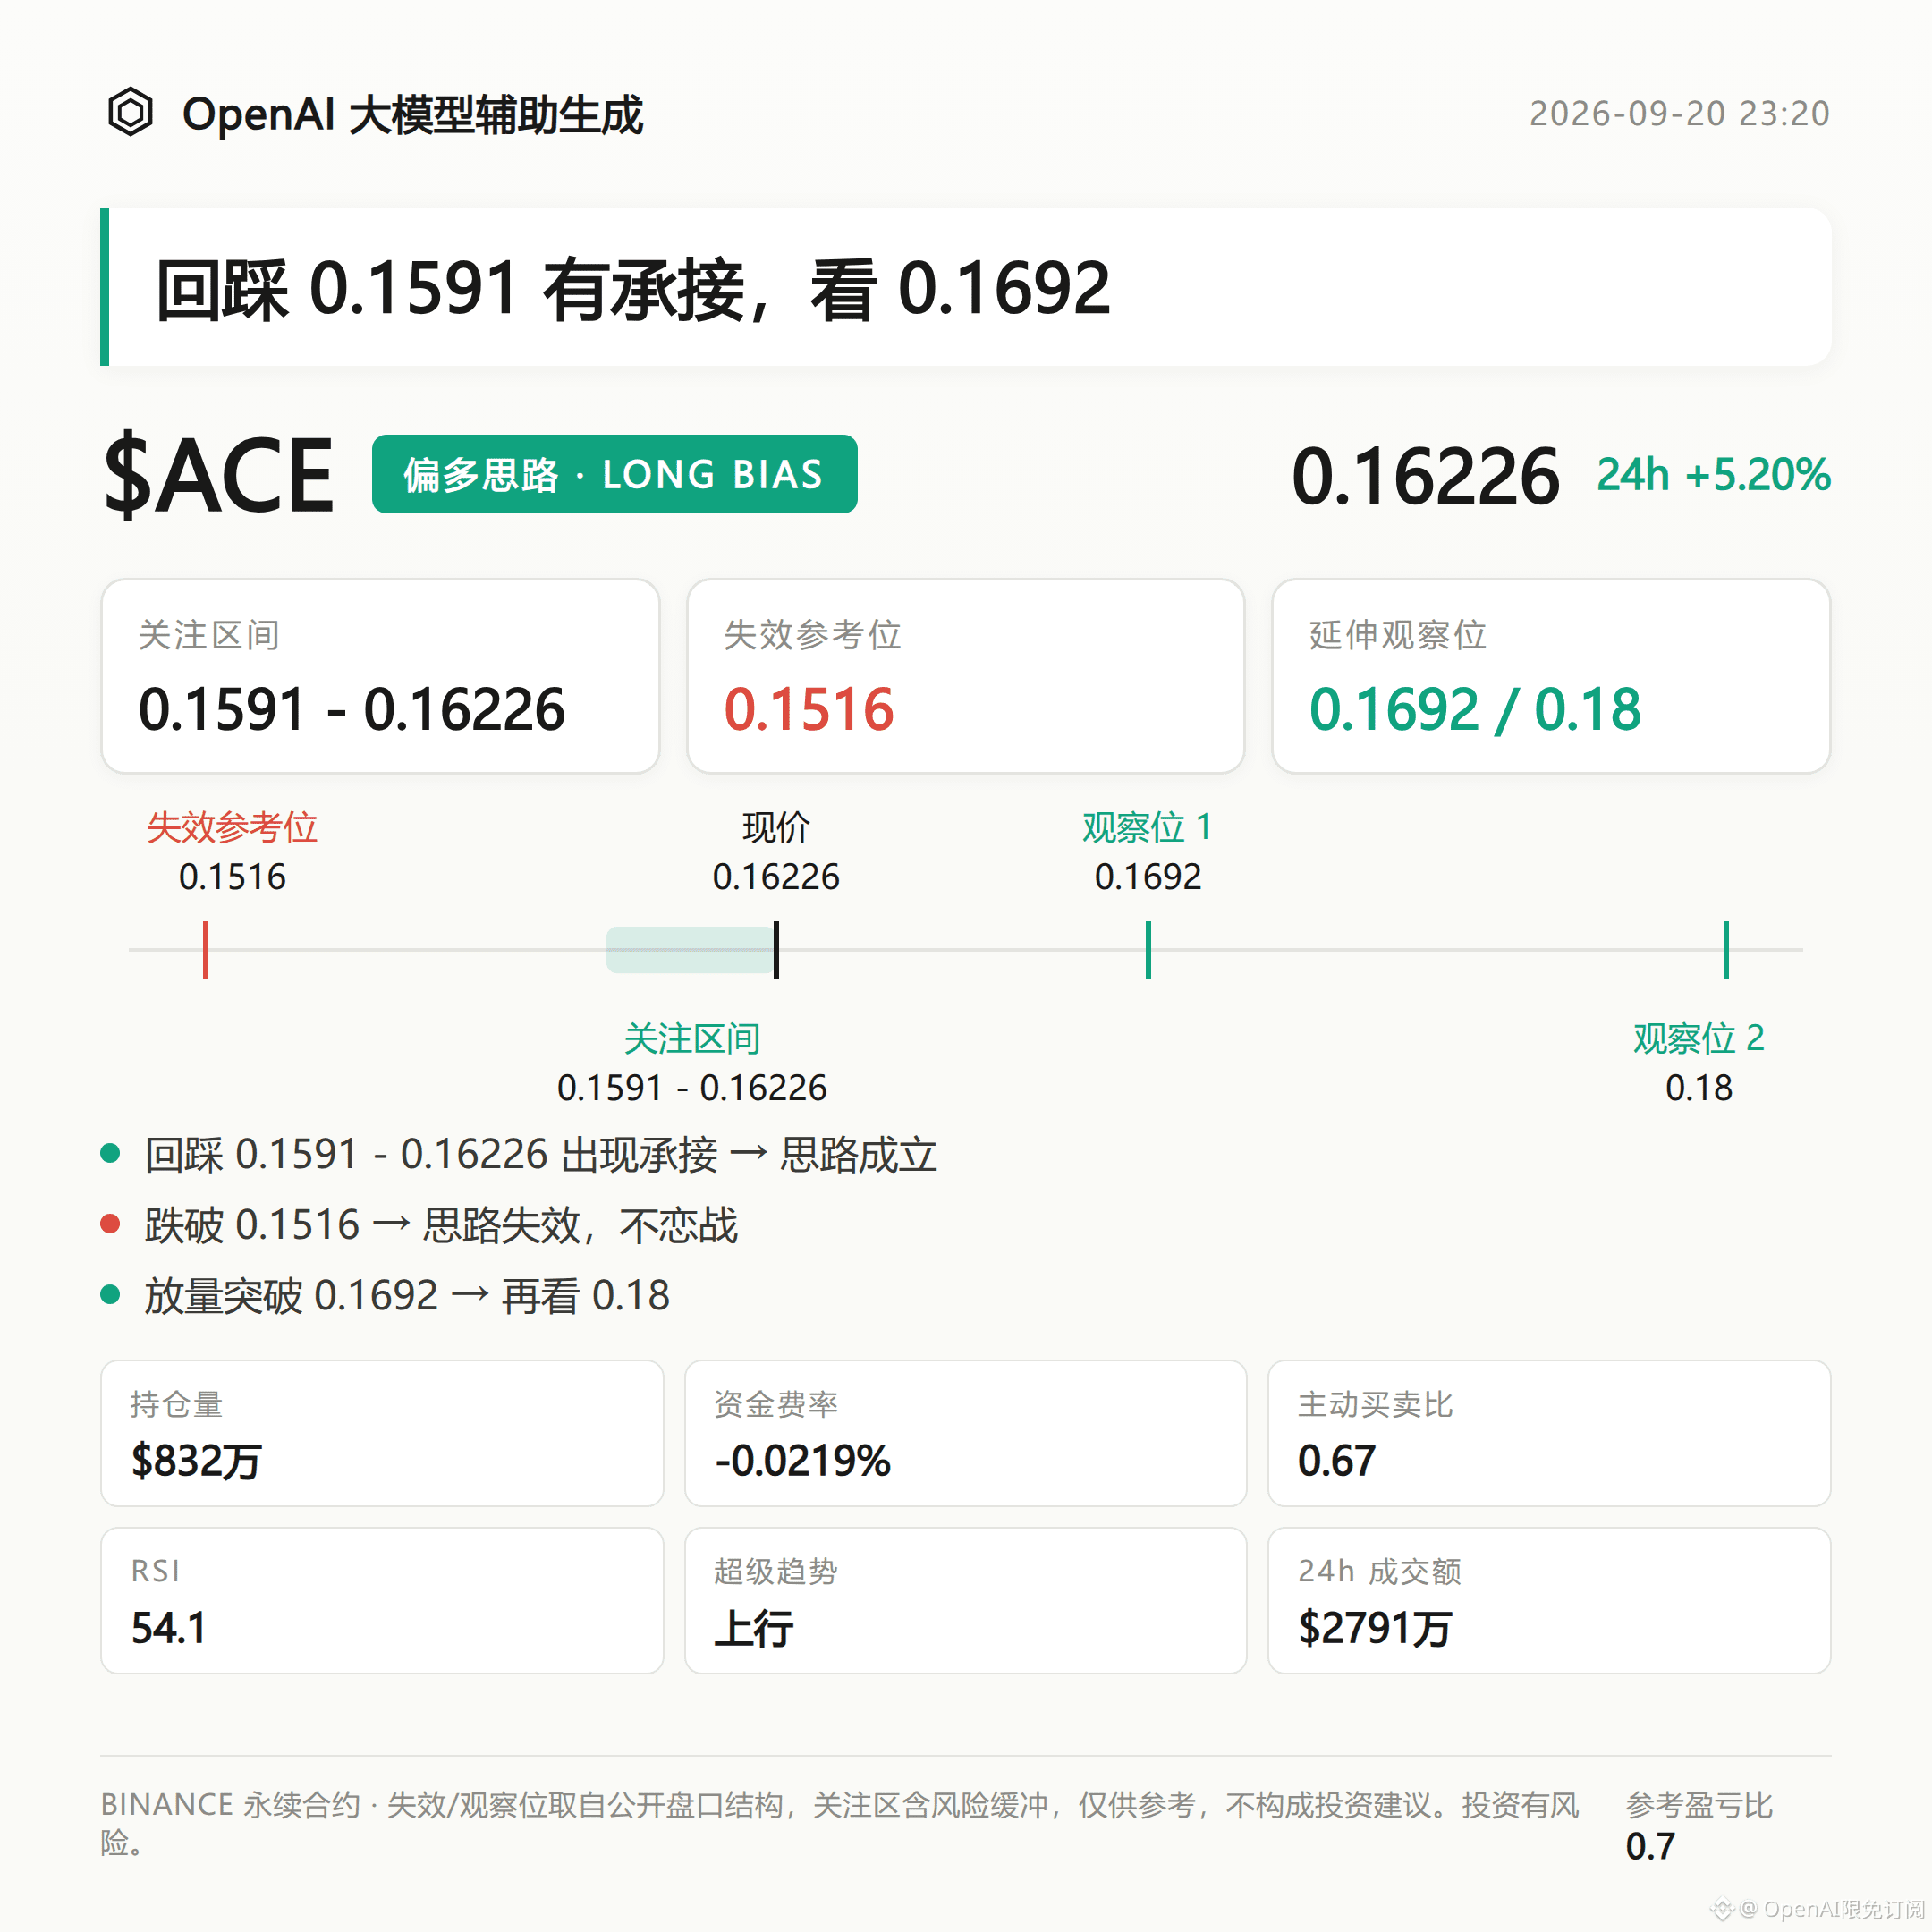
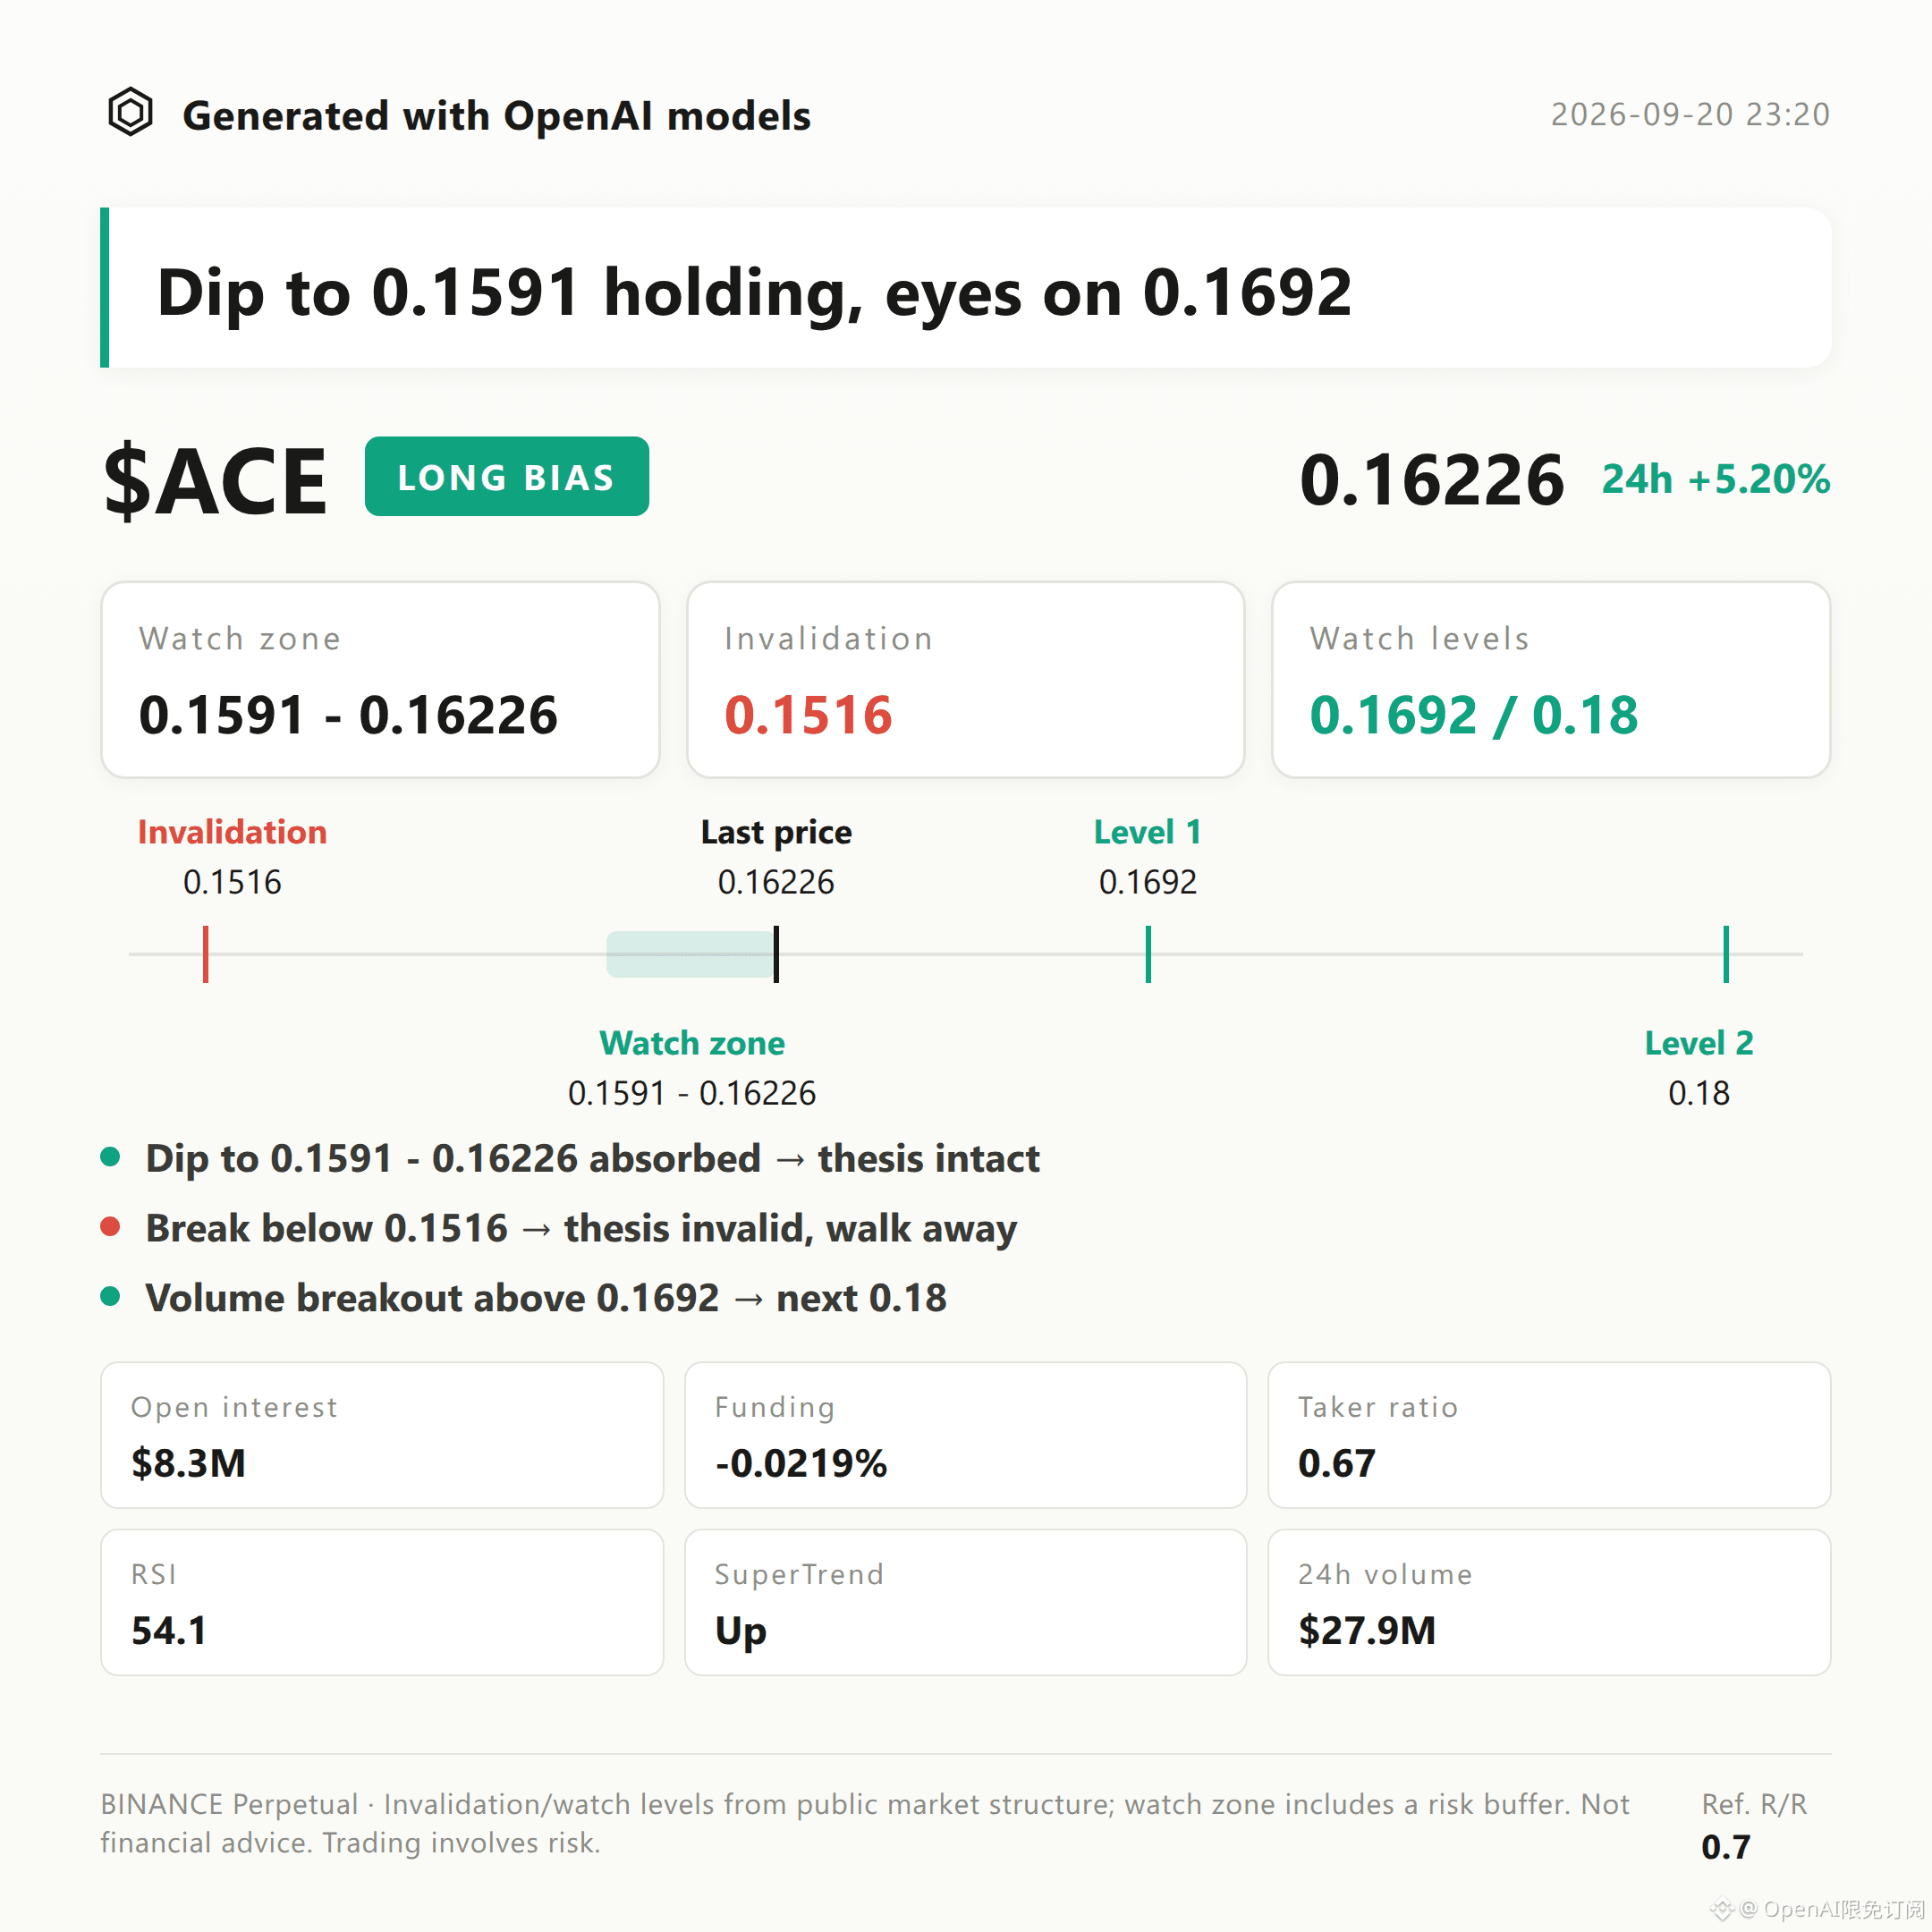
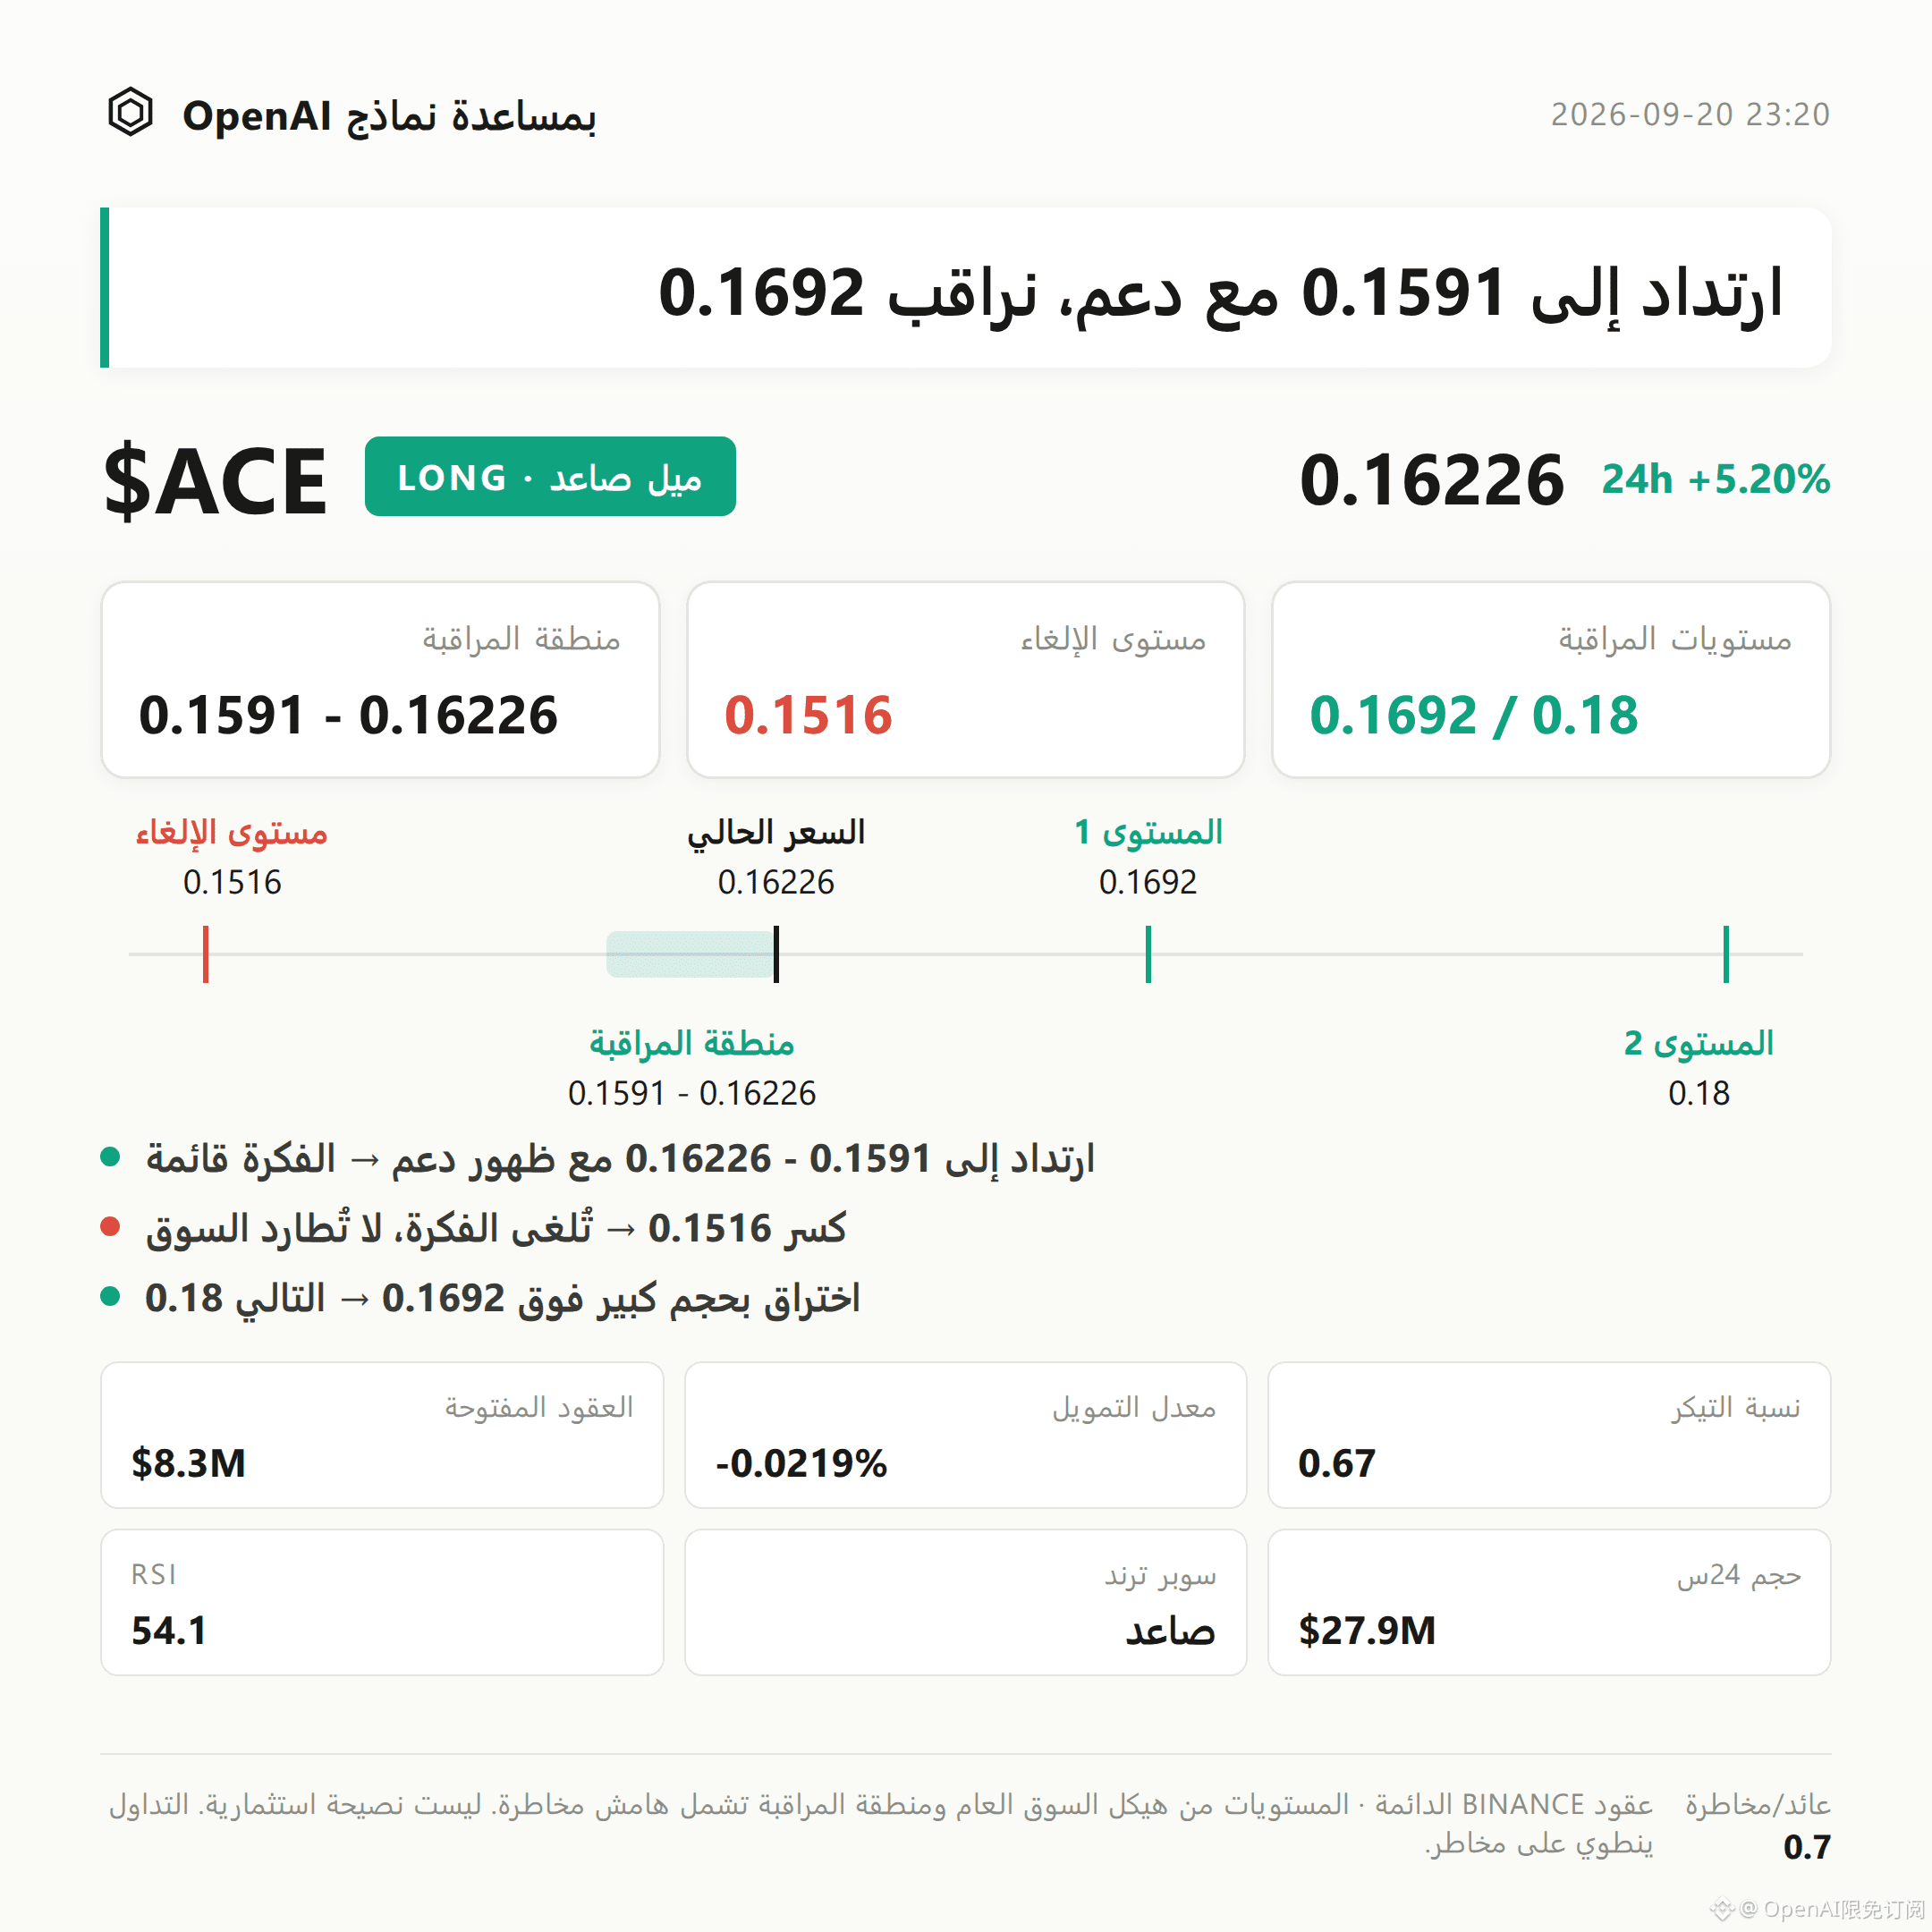
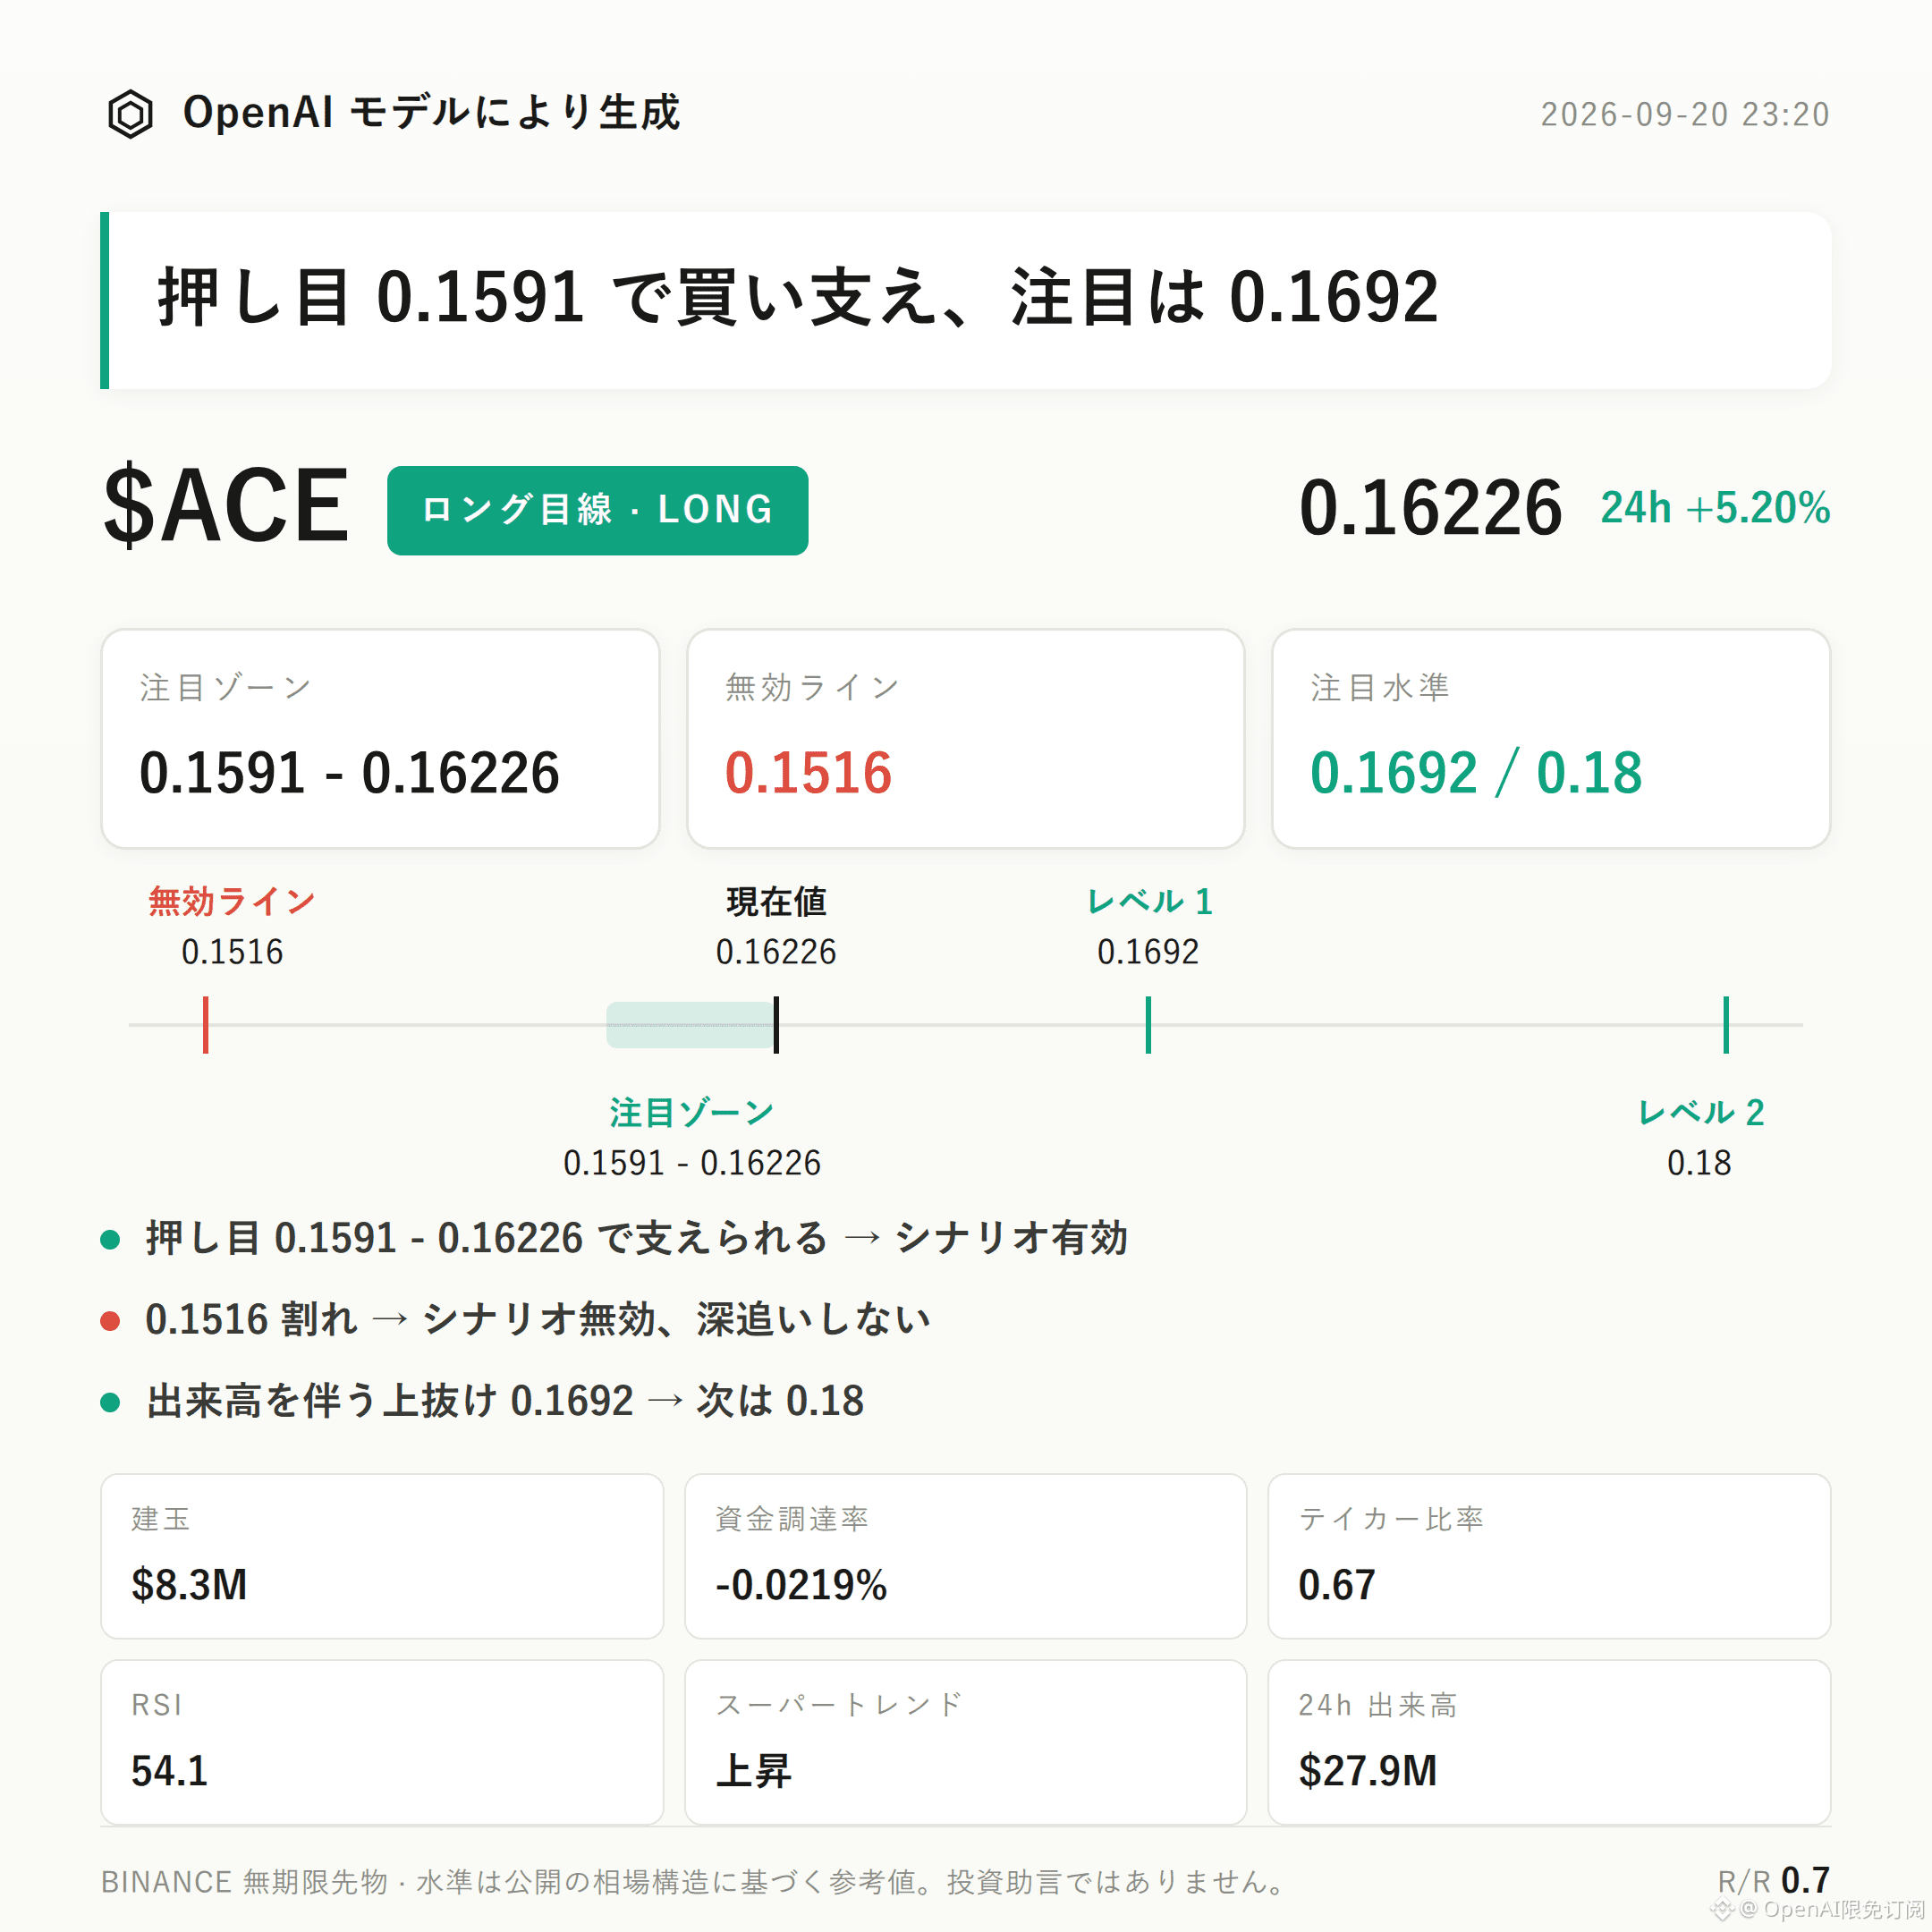
$ACE Bias: Bullish | Watch Range 0.1591 - 0.16226 | Invalidation Reference 0.1516 | Observation Levels 0.1692 / 0.18
$ACE ’s current structure is leaning bullish and is unfolding.
The Supertrend remains upward, the MACD holds bullish momentum, and the RSI is in a healthy zone around 54.1. Combined with the 24-hour uptrend of +5.20%, this forms the core basis for this round’s bullish observation.
The key is to see whether the bullish reference area can find support after a pullback—this will serve as a way to verify whether the idea continues.
From a technical structure perspective, the recent high is at 0.18, and the recent low is at 0.1516. The current price at 0.16226 is between the Bollinger middle band (0.1591) and the upper band (0.1692), indicating a relatively healthy trading range.
The Supertrend points upward; the bullish MACD momentum has not shown signs of exhaustion. An RSI of 54.1 is neither overheated nor weak. Overall, the structure favors continuation of the trend.
For derivatives data: 24-hour trading volume is approximately $27.91 million, open interest is about $8.32 million, and the 24-hour change is -4.0%.
The funding rate is -0.0219%. The long/short account ratio has longs at 45%, and the aggressive buy/sell ratio is 0.67.
Price levels can be tracked as follows:
For the bullish focus area, start with 0.1591 to 0.16226. It’s more suitable to wait for pullback support and then confirm. If this zone stabilizes and support holds, the bullish bias remains valid.
Place the invalidation reference at 0.1516. If it breaks down, it indicates the current push-up structure has been damaged, and the bullish idea is invalid—no need to keep fighting.
For the upside observation level, watch 0.1692. If a breakout continues with volume, then also monitor how price behaves around the 0.18 resistance area.
The actively disclosed downside risk is: the aggressive buy/sell ratio is currently 0.67, meaning buyers are not dominant, and there is some divergence between that and the upward trend. Open interest fell 4.0% over 24 hours, suggesting some participants are standing by or reducing positions. The funding rate is negative and the long account share is only 45%, implying bullish intent isn’t concentrated.
The approximate risk/reward ratio is about 0.7, so the risk-reward isn’t particularly strong. This post is only for structure observation and does not constitute any trading guidance. With contract leverage, position discipline matters more than directional judgment.
For reference only; this does not constitute investment advice. Contracts have leverage—trading involves risk.
This article was generated with assistance from an OpenAI model.
$ACE
#Contract Analysis
$ACE Bias: Bullish | Watch Range 0.1591 - 0.16226 | Invalidation Reference 0.1516 | Observation Levels 0.1692 / 0.18
$ACE ’s current structure is leaning bullish and is unfolding.
The Supertrend remains upward, the MACD holds bullish momentum, and the RSI is in a healthy zone around 54.1. Combined with the 24-hour uptrend of +5.20%, this forms the core basis for this round’s bullish observation.
The key is to see whether the bullish reference area can find support after a pullback—this will serve as a way to verify whether the idea continues.
From a technical structure perspective, the recent high is at 0.18, and the recent low is at 0.1516. The current price at 0.16226 is between the Bollinger middle band (0.1591) and the upper band (0.1692), indicating a relatively healthy trading range.
The Supertrend points upward; the bullish MACD momentum has not shown signs of exhaustion. An RSI of 54.1 is neither overheated nor weak. Overall, the structure favors continuation of the trend.
For derivatives data: 24-hour trading volume is approximately $27.91 million, open interest is about $8.32 million, and the 24-hour change is -4.0%.
The funding rate is -0.0219%. The long/short account ratio has longs at 45%, and the aggressive buy/sell ratio is 0.67.
Price levels can be tracked as follows:
For the bullish focus area, start with 0.1591 to 0.16226. It’s more suitable to wait for pullback support and then confirm. If this zone stabilizes and support holds, the bullish bias remains valid.
Place the invalidation reference at 0.1516. If it breaks down, it indicates the current push-up structure has been damaged, and the bullish idea is invalid—no need to keep fighting.
For the upside observation level, watch 0.1692. If a breakout continues with volume, then also monitor how price behaves around the 0.18 resistance area.
The actively disclosed downside risk is: the aggressive buy/sell ratio is currently 0.67, meaning buyers are not dominant, and there is some divergence between that and the upward trend. Open interest fell 4.0% over 24 hours, suggesting some participants are standing by or reducing positions. The funding rate is negative and the long account share is only 45%, implying bullish intent isn’t concentrated.
The approximate risk/reward ratio is about 0.7, so the risk-reward isn’t particularly strong. This post is only for structure observation and does not constitute any trading guidance. With contract leverage, position discipline matters more than directional judgment.
For reference only; this does not constitute investment advice. Contracts have leverage—trading involves risk.
This article was generated with assistance from an OpenAI model.
$ACE
#Contract Analysis