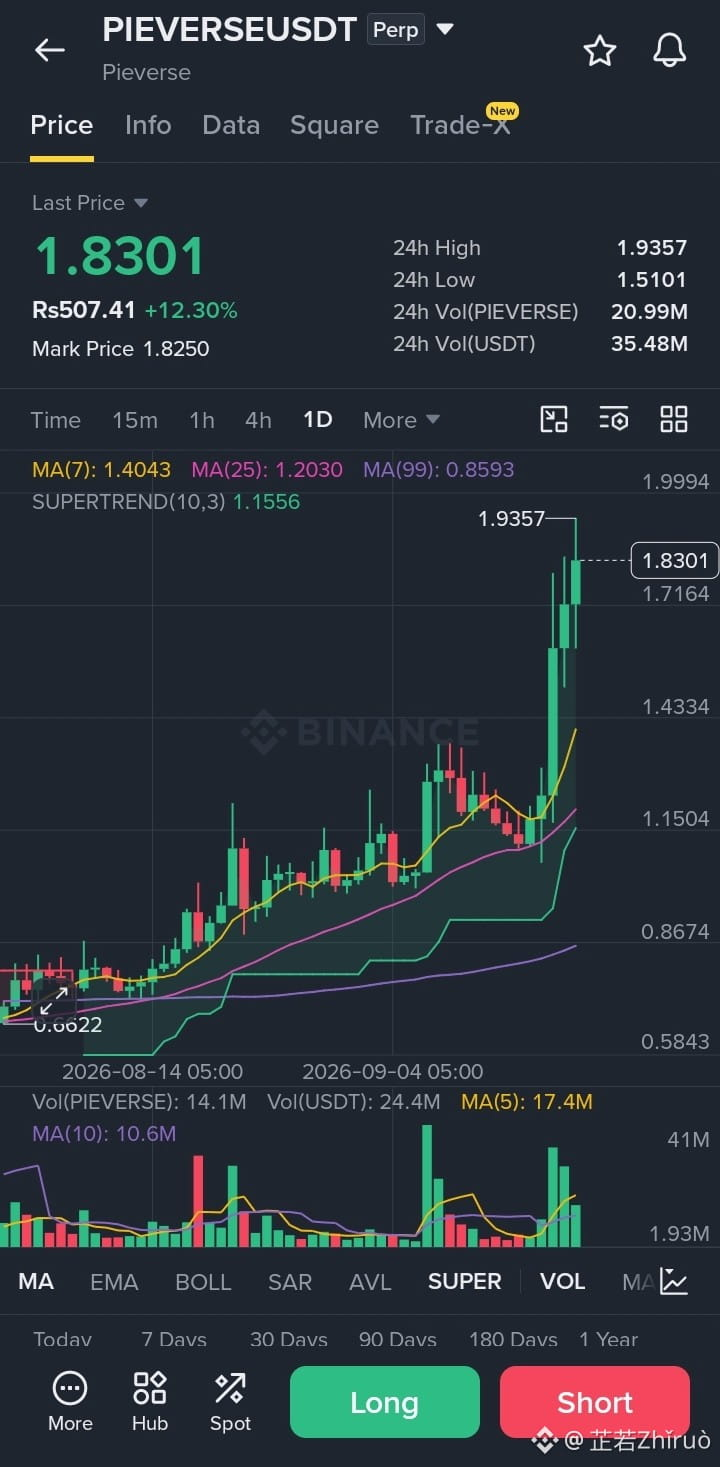
Based on the daily chart for $PIEVERSE
USDT Perp (Pieverse):
Key Technical Indicators & Data
* Current Price: 1.8301 USDT (+12.30%)
* Moving Averages (MAs):
* MA(7): 1.4043
* MA(25): 1.2030
* MA(99): 0.8593
* Observation: Price is in an aggressive vertical expansion well above all short-, medium-, and long-term moving averages.
* Supertrend Indicator (10,3):
* Supertrend Level: 1.1556 (Green)
* Observation: The Supertrend is green and stepping upward, confirming strong macro bullish momentum.
* Support & Resistance Levels:
* Immediate Support: ~1.7164 – 1.8000 (Local consolidation zone).
* Key Support: ~1.5101 (24h Low).
* Major Dynamic Support: 1.4043 (MA7 dynamic support line).
* Immediate Resistance: ~1.9357 (24h High and local peak).
* Psychological Target: 2.0000.
Chart Analysis
* Strong Parabolic Run: PIEVERSE has broken out from a higher-low consolidation pattern near ~1.1500 and surged toward the 1.9357 level.
* MA Stretch: Price is stretched significantly above the 1.4043 (MA7) dynamic trendline, signaling strong momentum but also potential for volatility or minor pullbacks to cool off overbought conditions.
* Volume Confirmation: The breakout is supported by consistent volume expansion (20.99M PIEVERSE / 35.48M USDT 24h volume).
Potential Trade Setups
Option A: Pullback Retest Entry (Long)
* Entry Range: 1.5100 – 1.6500 (Near the 24h low and intermediate support zone).
* Target 1: 1.8300
* Target 2: 1.9350 (24h High retest)
* Stop-Loss: Below 1.3800 (Below MA7 support).
Option B: Resistance Breakout Continuation
* Trigger: Daily candle close above 1.9400 (Clearing the 1.9357 peak).
* Target 1: 2.1500
* Target 2: 2.4000
* Stop-Loss: Below 1.7200.#VietnamPlansFirstCryptoLicensesIn2026 #BOJRaisesRatesTo31YearHigh
USDT Perp (Pieverse):
Key Technical Indicators & Data
* Current Price: 1.8301 USDT (+12.30%)
* Moving Averages (MAs):
* MA(7): 1.4043
* MA(25): 1.2030
* MA(99): 0.8593
* Observation: Price is in an aggressive vertical expansion well above all short-, medium-, and long-term moving averages.
* Supertrend Indicator (10,3):
* Supertrend Level: 1.1556 (Green)
* Observation: The Supertrend is green and stepping upward, confirming strong macro bullish momentum.
* Support & Resistance Levels:
* Immediate Support: ~1.7164 – 1.8000 (Local consolidation zone).
* Key Support: ~1.5101 (24h Low).
* Major Dynamic Support: 1.4043 (MA7 dynamic support line).
* Immediate Resistance: ~1.9357 (24h High and local peak).
* Psychological Target: 2.0000.
Chart Analysis
* Strong Parabolic Run: PIEVERSE has broken out from a higher-low consolidation pattern near ~1.1500 and surged toward the 1.9357 level.
* MA Stretch: Price is stretched significantly above the 1.4043 (MA7) dynamic trendline, signaling strong momentum but also potential for volatility or minor pullbacks to cool off overbought conditions.
* Volume Confirmation: The breakout is supported by consistent volume expansion (20.99M PIEVERSE / 35.48M USDT 24h volume).
Potential Trade Setups
Option A: Pullback Retest Entry (Long)
* Entry Range: 1.5100 – 1.6500 (Near the 24h low and intermediate support zone).
* Target 1: 1.8300
* Target 2: 1.9350 (24h High retest)
* Stop-Loss: Below 1.3800 (Below MA7 support).
Option B: Resistance Breakout Continuation
* Trigger: Daily candle close above 1.9400 (Clearing the 1.9357 peak).
* Target 1: 2.1500
* Target 2: 2.4000
* Stop-Loss: Below 1.7200.#VietnamPlansFirstCryptoLicensesIn2026 #BOJRaisesRatesTo31YearHigh