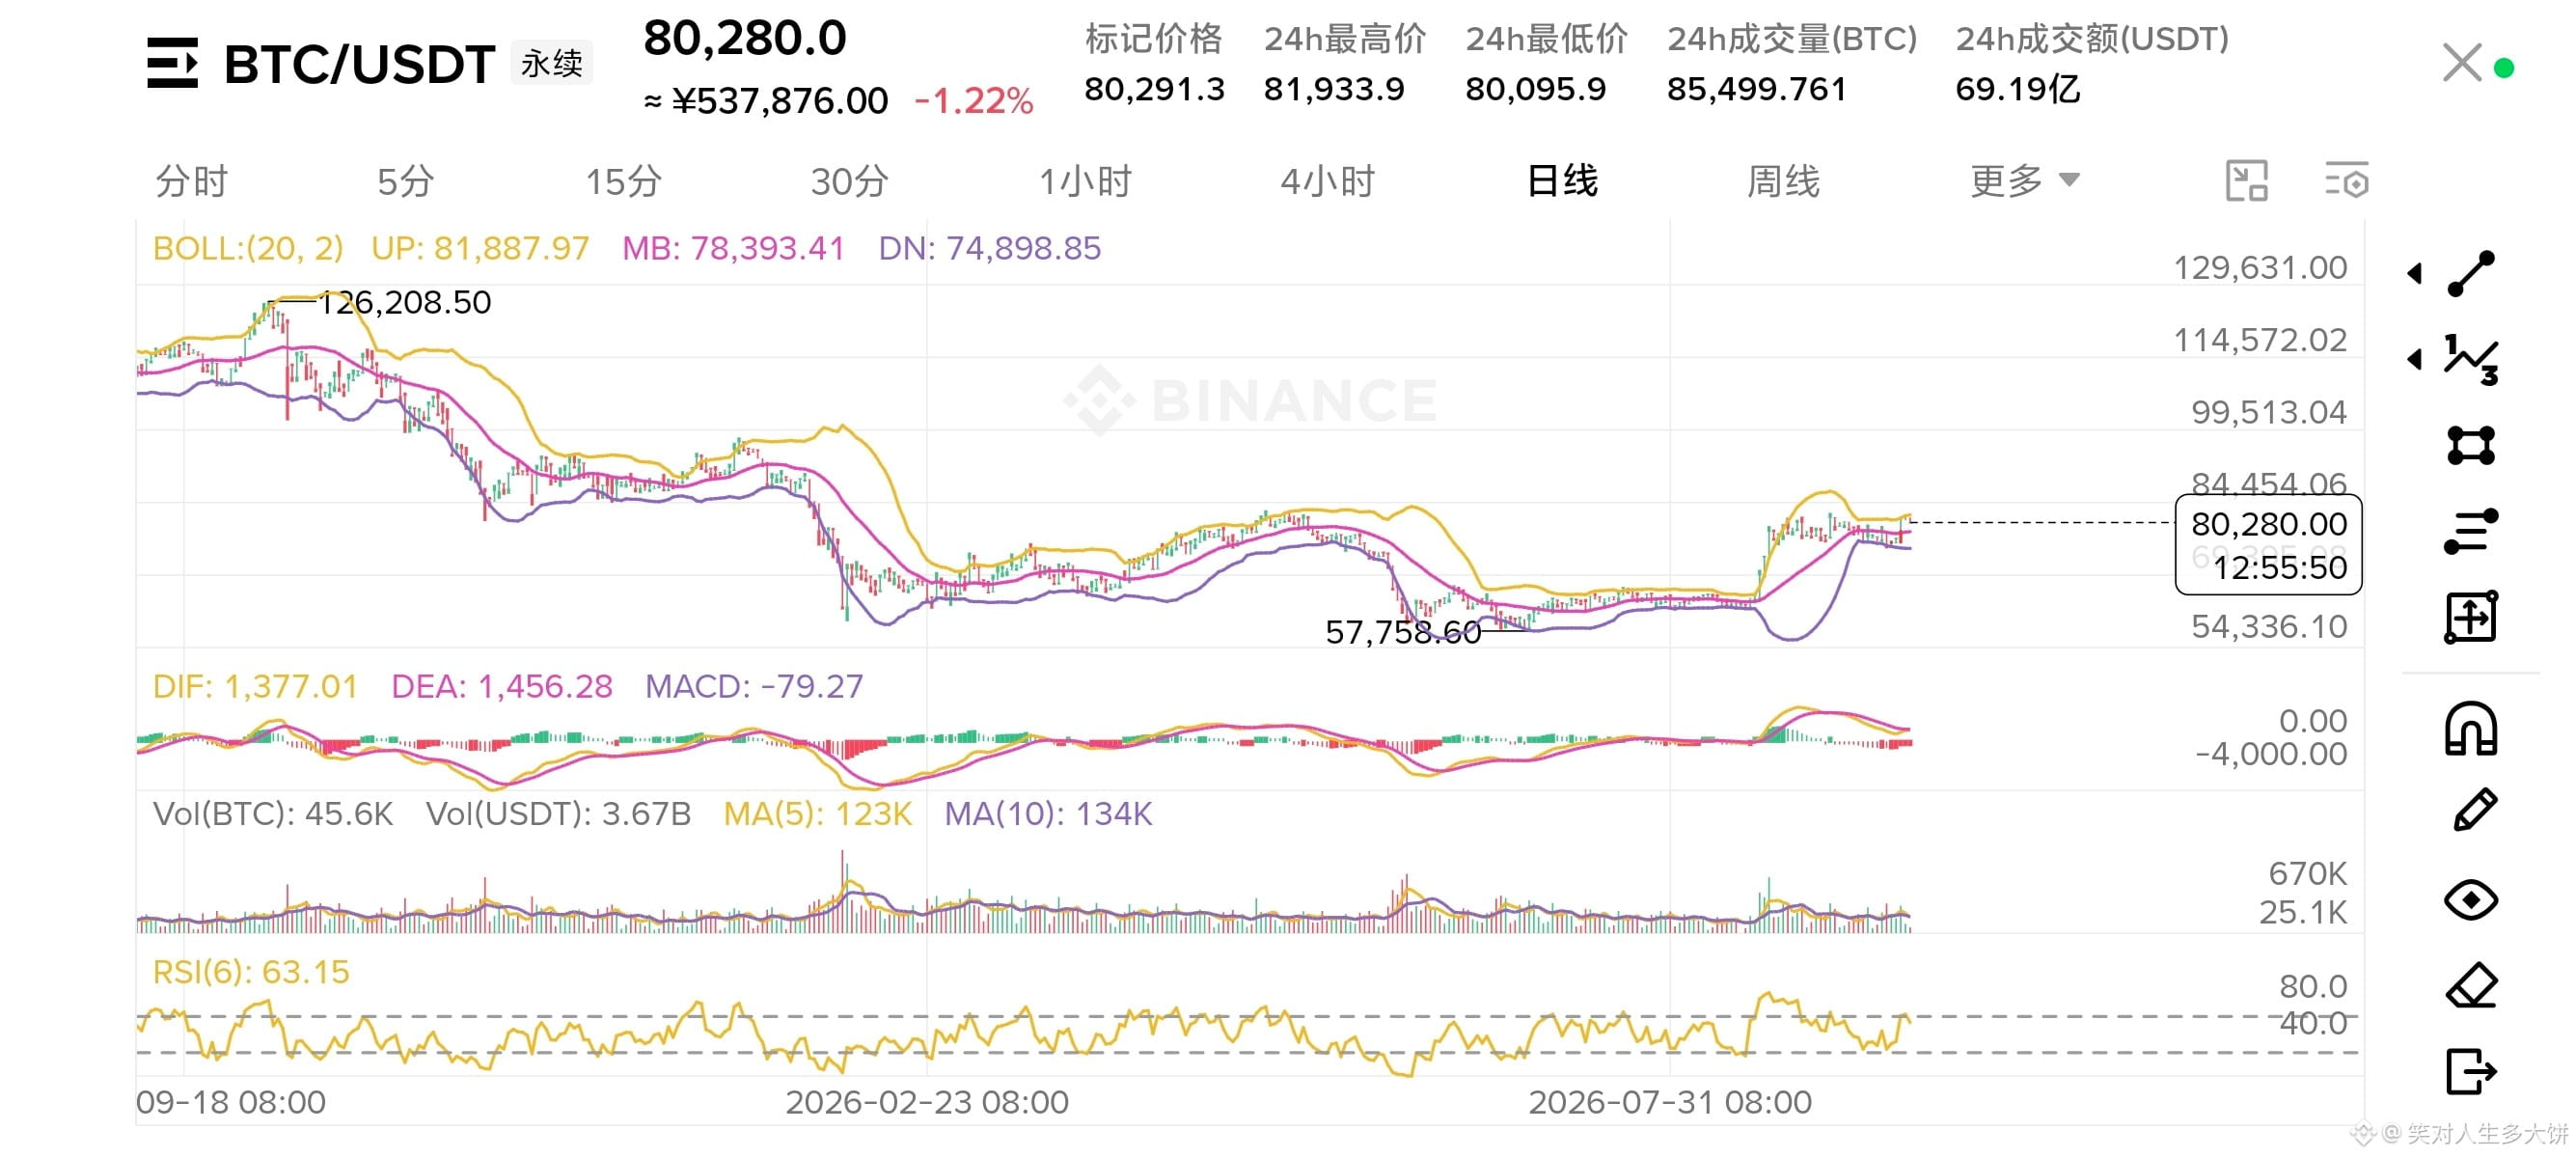
BTC daily chart W-bottom structure, and we’re now at the 80,000 level.
Technically, the double-bottom pattern has already formed. The Bollinger middle rail at 78,000 is a key support. Below that, there is a lot of accumulated positioning, so there is a possibility of a pullback to shake out (wash out) and re-accumulate.
However, there is also a real-world contradiction:
If the main force chooses not to pull back and instead directly breaks above the 84–85,000 neckline with a straight breakout, they would immediately miss this leg of the move.
In terms of risk-reward:
Defensive level: 78,000; first upside target: 85,000+; risk-reward ratio > 1:2.5.
But with high leverage, what I fear most is not being wrong on direction, but intraday needle spikes that sweep stop-losses.
Two approaches:
1️⃣ Enter a portion at the current price to avoid missing the move;
2️⃣ Place a resting order at 78,000 and wait for the shakeout to bring in liquidity.
If there is an effective breakdown below 78,000, the W-bottom pattern fails—then it’s important to give up the long thesis in time.
If it holds and stabilizes above 85,000 on strong volume, that’s when the pattern is confirmed—only then is there a chance to challenge the previous high at 120,000.
The market is always a probability game. Managing risk and controlling outcomes is more important than predicting direction.
#BTC
Technically, the double-bottom pattern has already formed. The Bollinger middle rail at 78,000 is a key support. Below that, there is a lot of accumulated positioning, so there is a possibility of a pullback to shake out (wash out) and re-accumulate.
However, there is also a real-world contradiction:
If the main force chooses not to pull back and instead directly breaks above the 84–85,000 neckline with a straight breakout, they would immediately miss this leg of the move.
In terms of risk-reward:
Defensive level: 78,000; first upside target: 85,000+; risk-reward ratio > 1:2.5.
But with high leverage, what I fear most is not being wrong on direction, but intraday needle spikes that sweep stop-losses.
Two approaches:
1️⃣ Enter a portion at the current price to avoid missing the move;
2️⃣ Place a resting order at 78,000 and wait for the shakeout to bring in liquidity.
If there is an effective breakdown below 78,000, the W-bottom pattern fails—then it’s important to give up the long thesis in time.
If it holds and stabilizes above 85,000 on strong volume, that’s when the pattern is confirmed—only then is there a chance to challenge the previous high at 120,000.
The market is always a probability game. Managing risk and controlling outcomes is more important than predicting direction.
#BTC