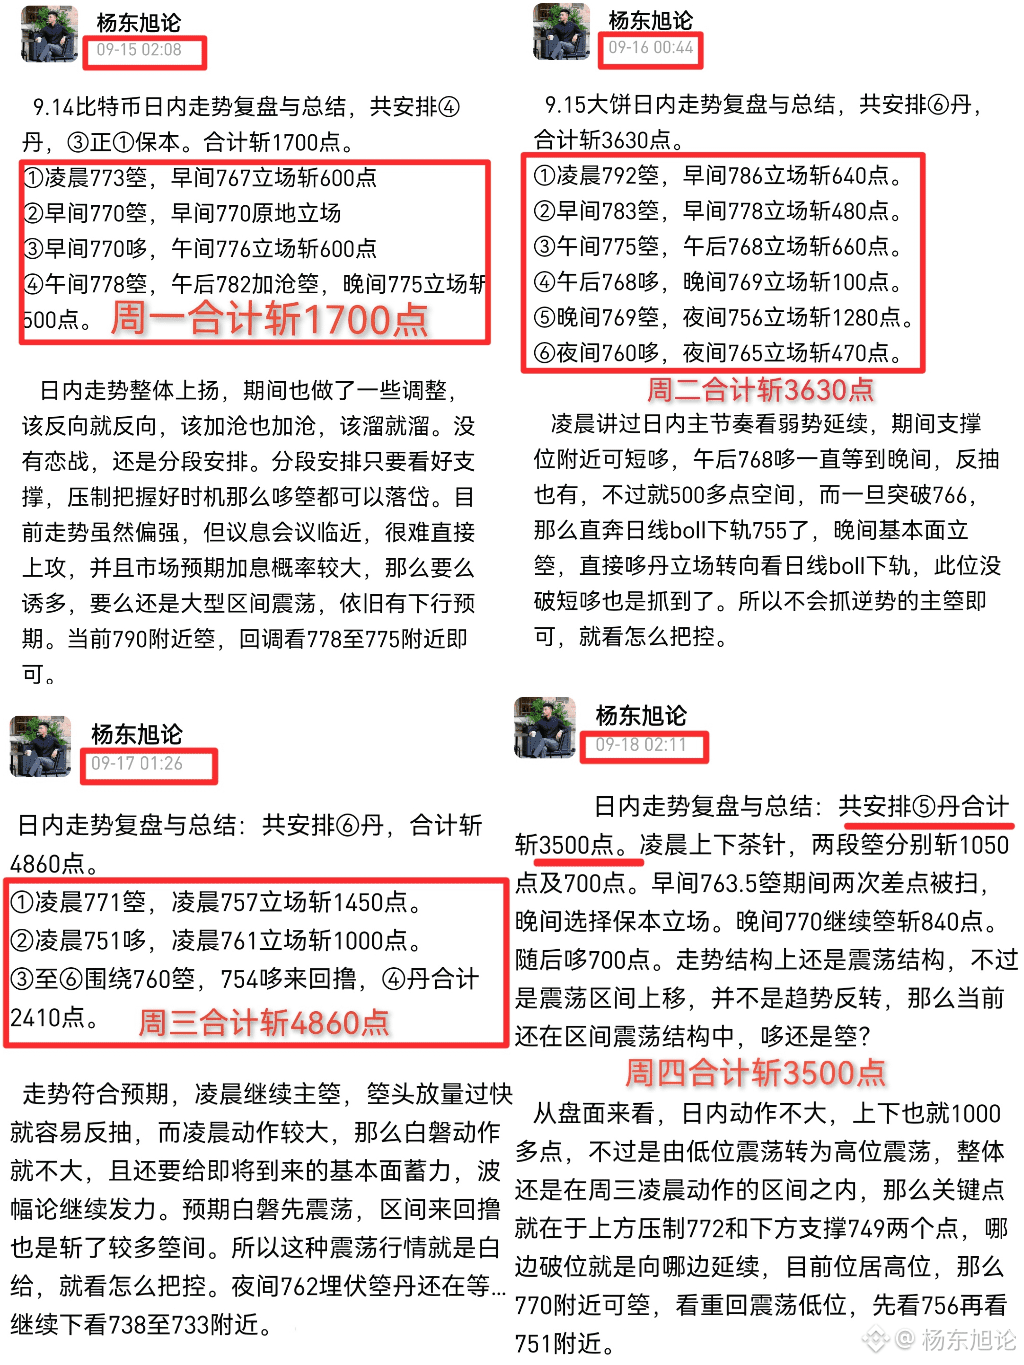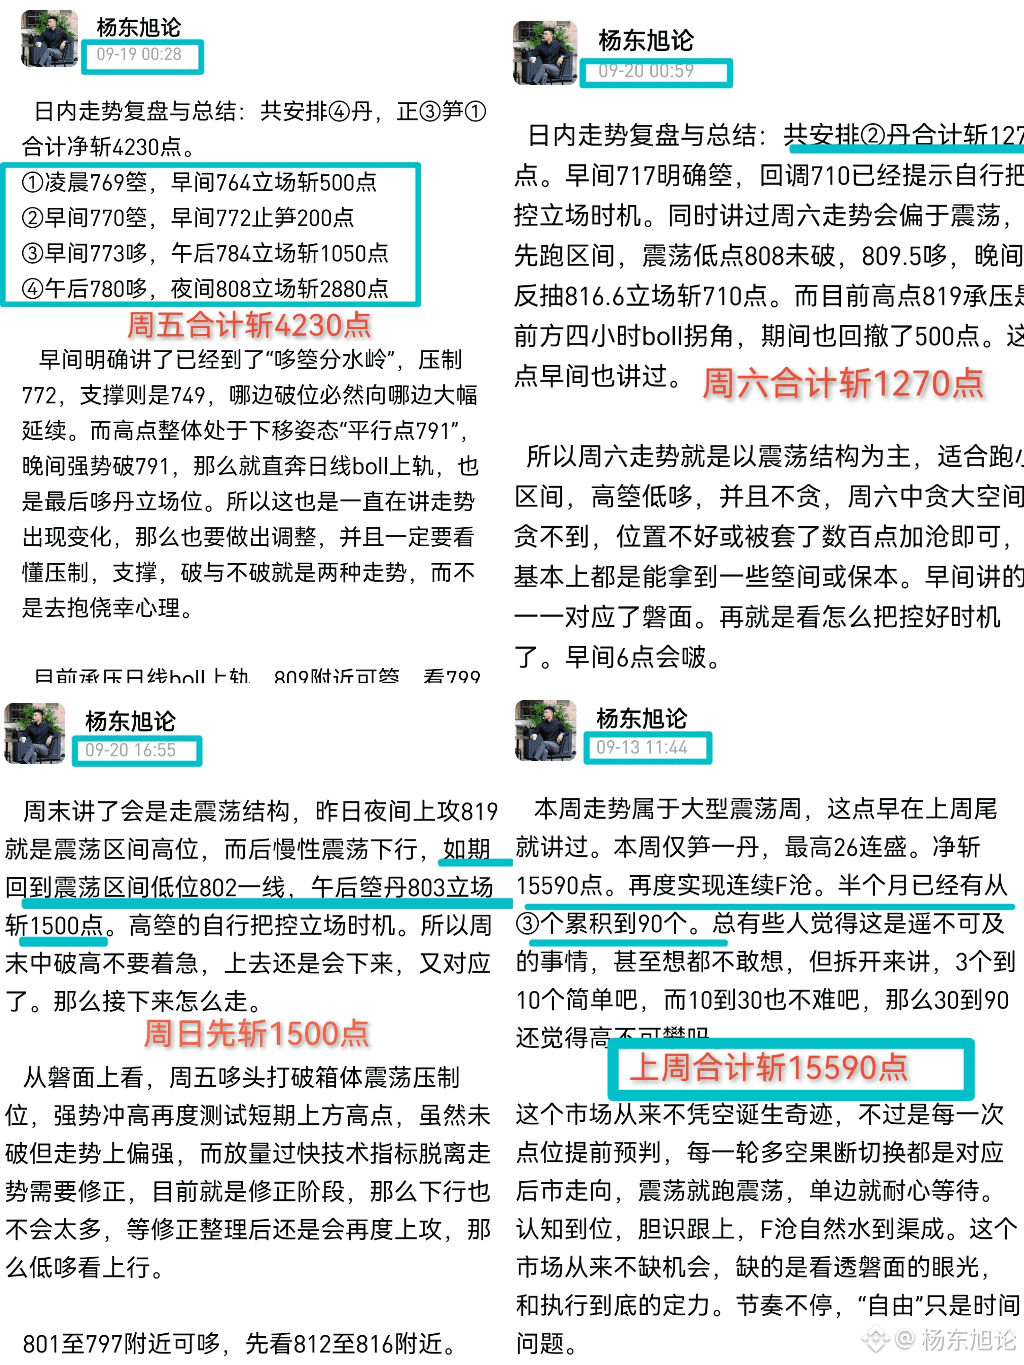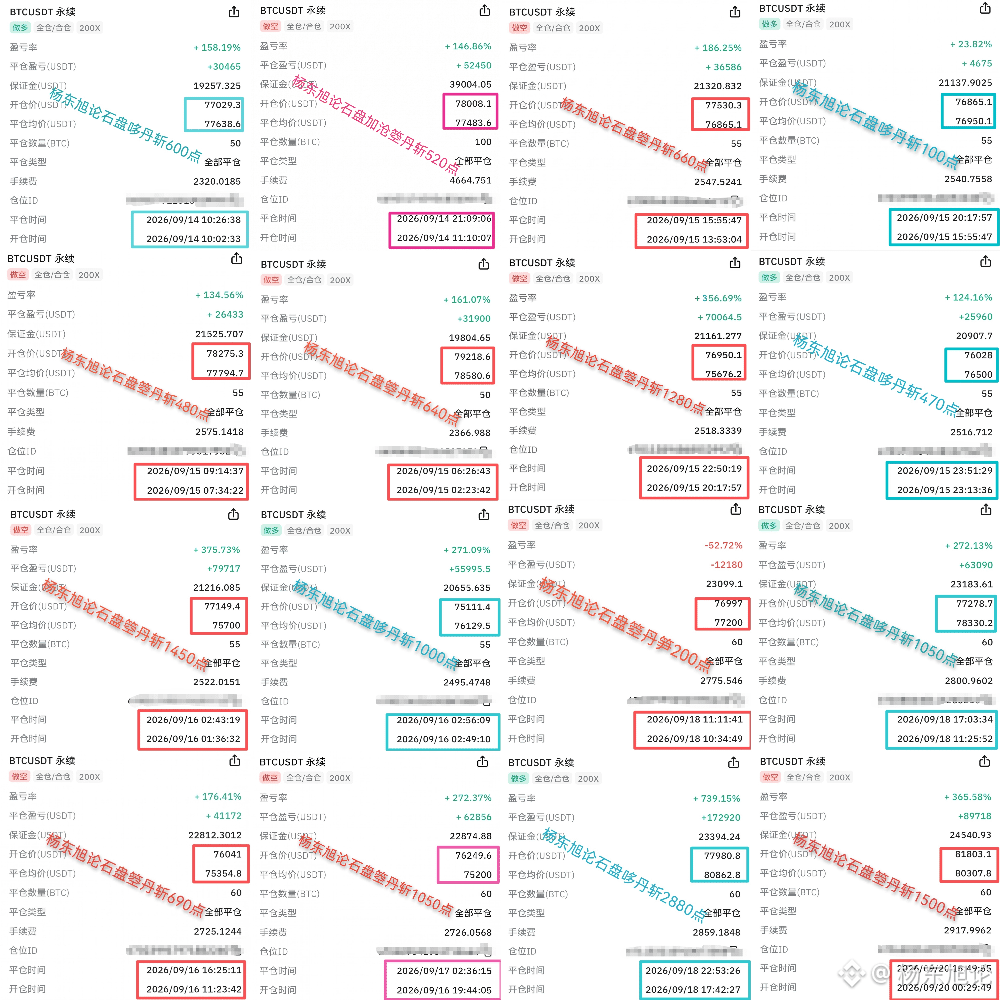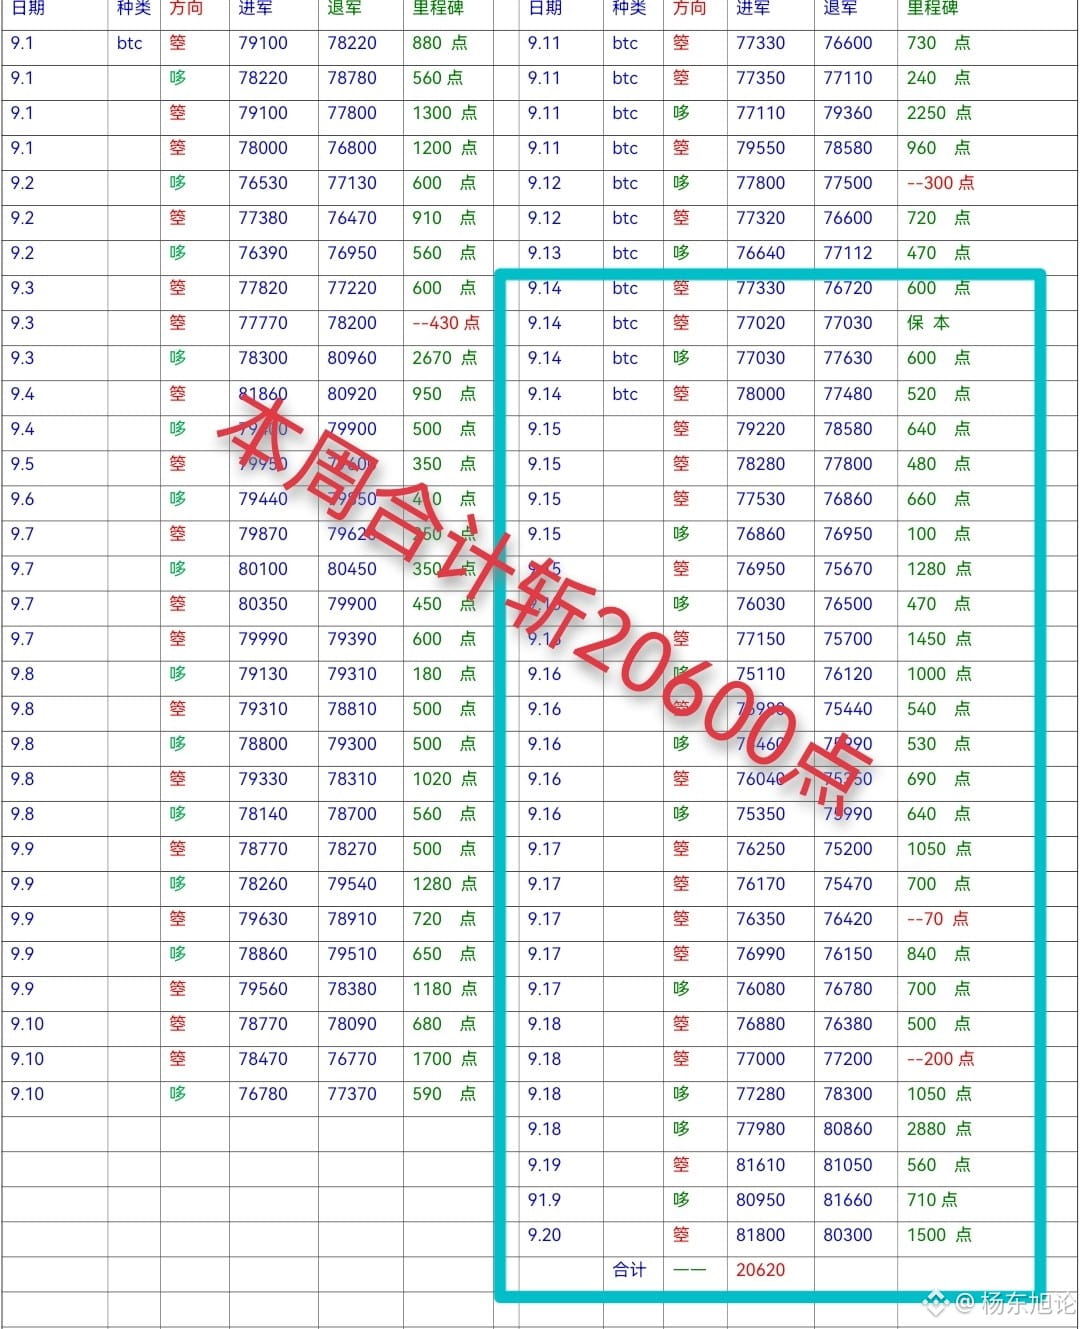
Big Pancake This Week: Price Action Review and Next Week Forecast: This week totaled a gain of 20,600 points. Early in the week, it first tested the 80,000 mark, then clearly avoided chasing at the high level; it showed weakness and subsequently came under pressure and pulled back, with the weak trend continuing. In the early hours of Wednesday, fundamentals moved from 772 down to 749, and then it entered a box-range consolidation. The plan was clear: trade within the range—go long on a breakout to one side, and go long only when the other side breaks; don’t guess, follow the breakout. By Friday, after the price head broke out of the range, it surged strongly on expanding volume, decisively chasing the move after the box-range consolidation broke. As for the weekend, the outlook is range-bound consolidation, and the price structure is also one of consolidation. Every step corresponds to the future direction—key resistance levels and support levels: whether a level breaks or holds results in two different scenarios. That’s what we’ve always emphasized—look at the order book/price action, not guesswork… So how will next week go…
From the chart, in the short term the price will continue to pull back and forth in a tug-of-war. After a strong rebound from the 626 area at the end of last month, the high area has been consolidating for four straight weeks. On the weekly chart, bullish and bearish candles alternate; sell pressure lies above, buy support lies below—both sides are tightly locked. But the market won’t consolidate endlessly. Even though there were rate hikes this week, it still failed to drop; that increases the likelihood of a renewed push upward. Meanwhile, it returns above 80,000 again, and market sentiment turns greedy and euphoric, with expectations for further upside. For the downside, keep an eye on 79,600 and 78,600 key support levels—these are the head trend lines. As long as pullbacks don’t break these two levels, the overall trend is still bullish. After the weekly close, if the Bollinger upper band continues to extend upward, it will test the 86,600 level of the prior weekly candlestick body energy column. Next week’s low is expected to see upside. $BTC
$ETH
#日本央行加息至31年高位 #华夏基金完成港元稳定币投资用例 #越南拟2026年发首批加密牌照
From the chart, in the short term the price will continue to pull back and forth in a tug-of-war. After a strong rebound from the 626 area at the end of last month, the high area has been consolidating for four straight weeks. On the weekly chart, bullish and bearish candles alternate; sell pressure lies above, buy support lies below—both sides are tightly locked. But the market won’t consolidate endlessly. Even though there were rate hikes this week, it still failed to drop; that increases the likelihood of a renewed push upward. Meanwhile, it returns above 80,000 again, and market sentiment turns greedy and euphoric, with expectations for further upside. For the downside, keep an eye on 79,600 and 78,600 key support levels—these are the head trend lines. As long as pullbacks don’t break these two levels, the overall trend is still bullish. After the weekly close, if the Bollinger upper band continues to extend upward, it will test the 86,600 level of the prior weekly candlestick body energy column. Next week’s low is expected to see upside. $BTC
$ETH
#日本央行加息至31年高位 #华夏基金完成港元稳定币投资用例 #越南拟2026年发首批加密牌照