
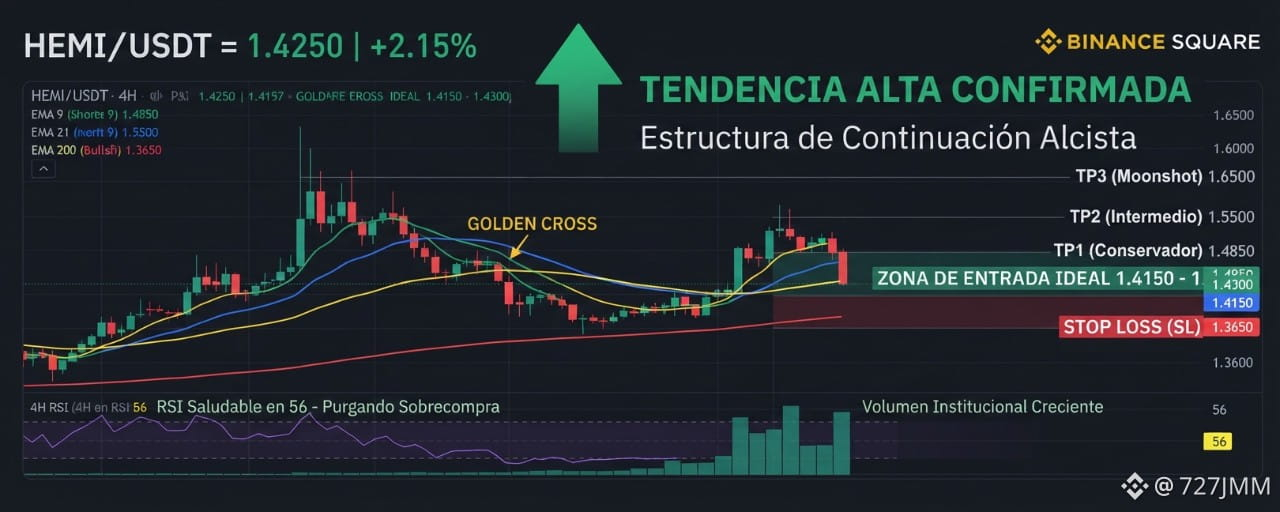


Situation analysis (1H / 4H / Daily) Currently, the HEMI/USDT pair is trading at $1.4250, consolidating a clear bullish trend after successfully breaking through the prior accumulation zone. On the 1H and 4H timeframes, we observe a flawless Golden Cross, with the EMA 9 crossing above the EMA 21, dynamically supported by the MA 50. On the daily chart, the EMA 200 acts as the structural foundation of the larger bullish macro-trend, while the MA 100 supports intermediate levels. Meanwhile, the 4H RSI is at a healthy 56, recovering from a test at the 50 level and eliminating any signs of prior overbought conditions, as institutional volume backs each impulse candle with steadily increasing buying pressure.
Trade Setup Configuration
Ideal entry zone: $1.4150 - $1.4300 (Institutional order block and dynamic support).
Tp1 (Conservative): $1.4850 (Local short-term resistance to secure initial benefits).
Tp2 (Intermediate): $1.5500 (Bullish channel top and relevant psychological level).
Tp3 (Moonshot): $1.6500 (Fibonacci extension projection 1.618).
Stop Loss (SL): $1.3650 (Strict technical invalidation level, below the MA 100 and structural support).
Trading range: We enter in this bullish leg because the price is executing a perfect pullback to the 0.382 Fibonacci retracement and direct confluence with the EMA 21 on the 4H chart. The temporary decrease in volume during this pullback confirms it’s simply a consolidation pause and not distribution. Strong hands are absorbing the available supply to push the next parabolic leg with maximum efficiency. Precise risk management—let’s secure profits, community!