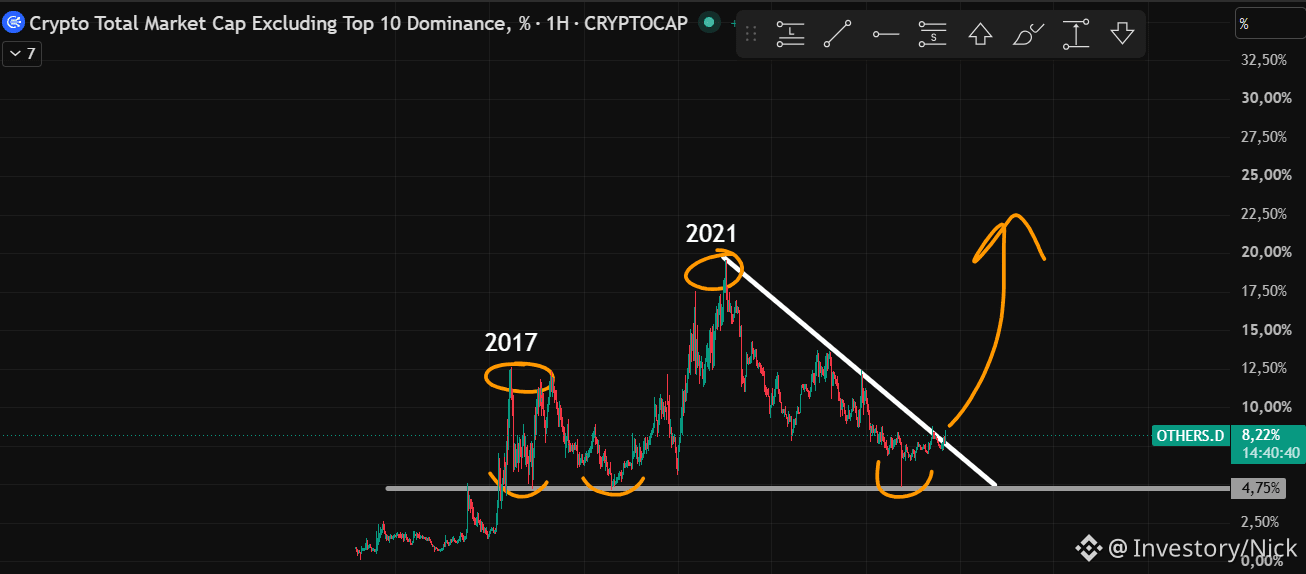
#BTC Price Analysis# Are there those who are waiting for altcoin growth or the so-called “alt season”? 😅 Maybe someone missed it and didn’t see it) In the chart you can observe the ratio of altcoins to $BTC. In short, it shows the strength of Bitcoin or altcoins. So if we move down, Bitcoin is strong and coins fall. If the chart is going up, it’s the exact opposite. The dominance, even shorter) And as you might have noticed, those very “alt seasons” happened specifically during the period of growth of this chart. Look at 2017 and 2021. Growth begins when the trend changes from downward to upward. The white line is that very trend. Exactly after it breaks, the chart starts to rise, and along with it, the altcoins. Right now, we’ve just broken through this downtrend that lasted 4 years. And even by cycles, growth happens roughly once every 4 years. I think you’re noticing that altcoin growth has been happening lately. From the 2017 alt season, it also took 4 years and only in 2021 did we see a strong market uptrend. Only now have we started to break through this trend 🔥 And if you don’t know what to pick up ahead of time, so to speak, in my TG channel (link in the description and pinned message), I shared my trades in coins where I expect growth of more than +100%, and also yesterday I recorded a big market overview video in which we broke down our positions in altcoin, Bitcoin, and $ETH 🚀 Don’t miss it ❤️

Post