
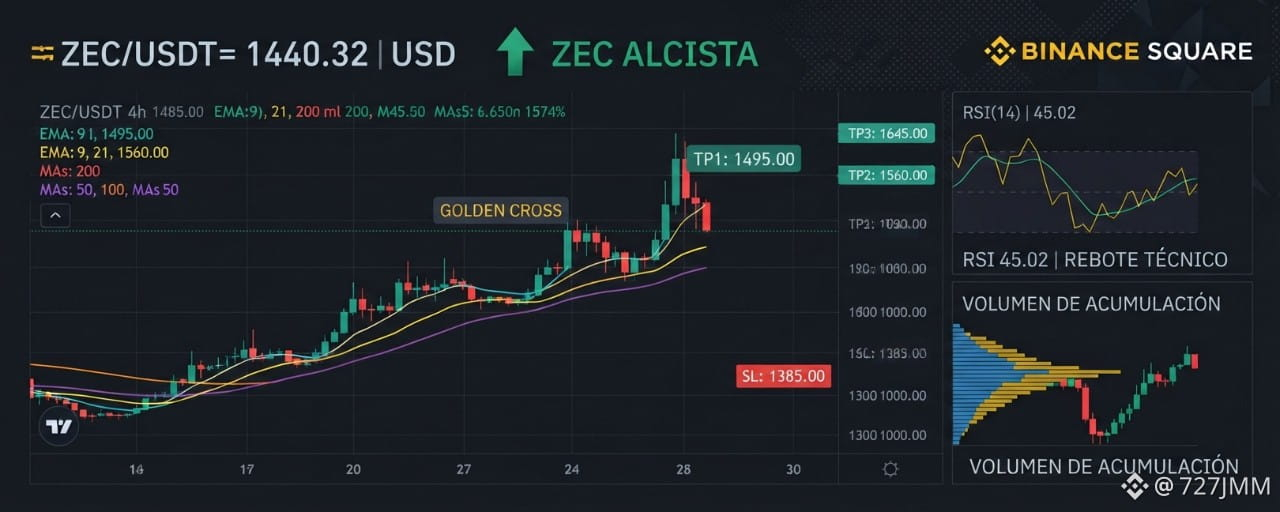


Situation analysis (1H / 4H / Daily) Currently, ZEC/USDT ($1440.32) shows a clear bullish trend structure after exiting an aggressive accumulation phase. In the 4H chart, we observe a recent Golden Cross where the EMA 9 crossed above the EMA 21, supported by a MA 50 that acts as an impeccable dynamic support. On the Daily timeframe, the EMA 200 remains with a positive slope, confirming the macro trend. The RSI (4H) has reset to 45 (coming out of overbought) forming a hidden bullish divergence, along with a notable contraction in volume during this pullback, which validates the health of the move.
Trade Setup
Ideal entry zone: $1435.00 - $1445.00 (High confluence zone).
Tp1 (Conservative): $1495.00 (Local resistance to secure the first 30% of gains).
Tp2 (Intermediate): $1560.00 (Key psychological level and ceiling of the previous channel).
Tp3 (Moonshot): $1645.00 (1.618 Fibonacci extension of the last impulse).
Stop Loss (SL): $1385.00 (Strict technical invalidation. Close below the MA 100 and loss of the psychological support of $1400).
Trade Range We enter this long position because the price is executing a precise rebound at the 0.382 Fibonacci retracement level ($1438), with exact confluence with the 21 EMA and the 50 MA on the 4H timeframe. The RSI has cleared the prior exhaustion, and the drying up of sell volume indicates that strong hands are absorbing the supply. It is a high-probability setup (R/R).