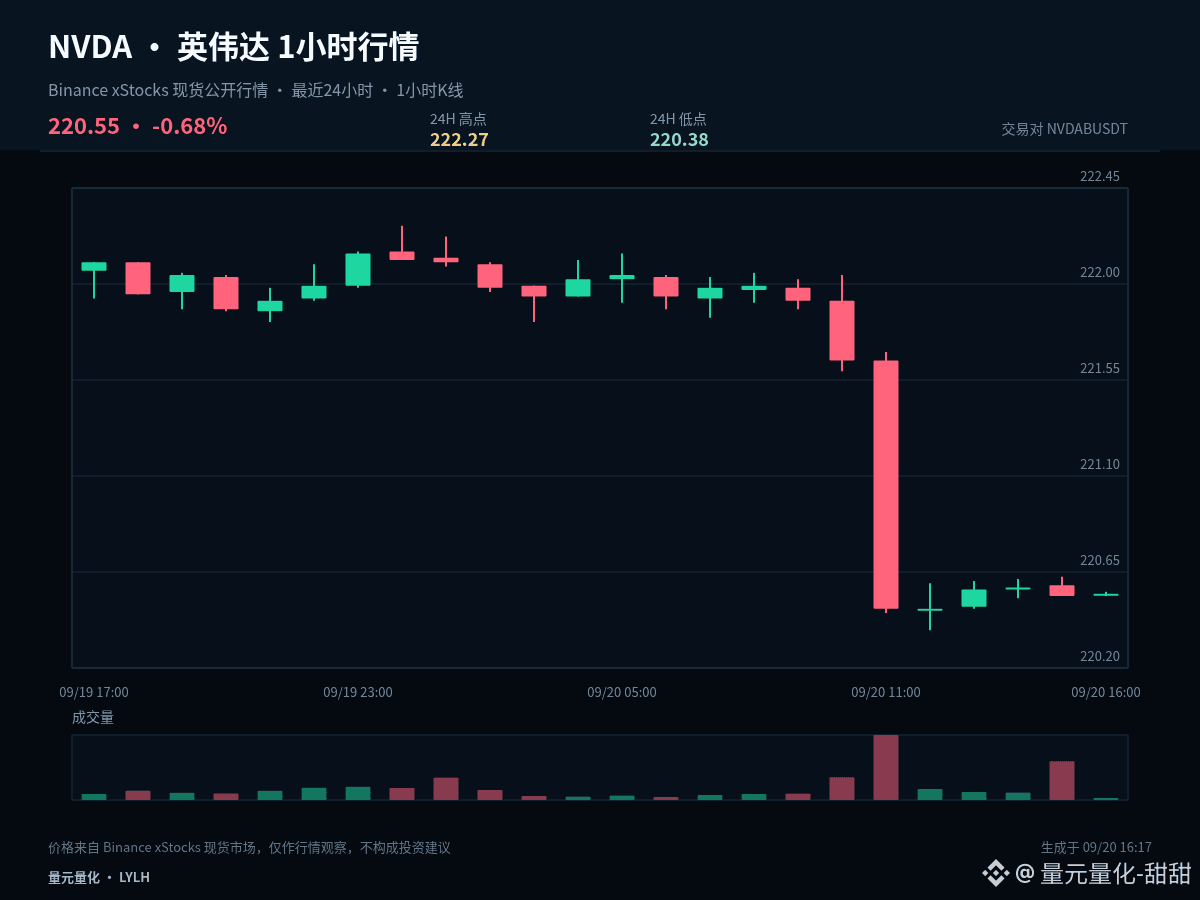
$NVDAB #NVDA Current price 220.55, 1 hour +0.00%, 24 hours -0.65%. Instead of trying to guess long or short too early, it’s better to lay out the possible paths and the corresponding actions.
The current price is near the lower end of the past 24-hour range: 1 hour +0.00%, 24 hours -0.65%. The core of analyzing the lows isn’t about bottom-fishing in advance, but about observing whether it can quickly rebound after a break; if it can rebound, it indicates sell pressure is being absorbed. If it continues to linger below the lower end, it suggests that weakness hasn’t ended yet.
The first path is upward: price needs to break above 222.27 and form stable closes above it. Only then is a subsequent retest that holds considered an effective confirmation. The second path is downward: 220.38—once this level is breached and the rebound fails to recover, it indicates insufficient support. In that case, prioritize defense rather than rushing to add positions.
If price continues to stay between 222.27 and 220.38, 221.325 is only a short-term reference for who holds control. The middle of the range has no clear advantage, so don’t force entries just for the sake of participation—wait for the market to show a direction.
For existing positions, handle them in stages based on the key levels, avoiding making all decisions at once. For those with no position, wait for breakout confirmation or a pullback that stabilizes. Also note that U.S. stock underlyings may experience volatility from trading-session switches; your plan should be based on price conditions, not replaced by emotion.
The focus of a short-term position isn’t predicting every single candlestick, but ensuring there’s a rationale for entry, trimming, and exiting. Do less without confirmation, redo the plan if key levels fail—control single-trade risk first, then consider the potential upside/downside afterward.
#BOJRaisesRatesTo31YearHigh
The current price is near the lower end of the past 24-hour range: 1 hour +0.00%, 24 hours -0.65%. The core of analyzing the lows isn’t about bottom-fishing in advance, but about observing whether it can quickly rebound after a break; if it can rebound, it indicates sell pressure is being absorbed. If it continues to linger below the lower end, it suggests that weakness hasn’t ended yet.
The first path is upward: price needs to break above 222.27 and form stable closes above it. Only then is a subsequent retest that holds considered an effective confirmation. The second path is downward: 220.38—once this level is breached and the rebound fails to recover, it indicates insufficient support. In that case, prioritize defense rather than rushing to add positions.
If price continues to stay between 222.27 and 220.38, 221.325 is only a short-term reference for who holds control. The middle of the range has no clear advantage, so don’t force entries just for the sake of participation—wait for the market to show a direction.
For existing positions, handle them in stages based on the key levels, avoiding making all decisions at once. For those with no position, wait for breakout confirmation or a pullback that stabilizes. Also note that U.S. stock underlyings may experience volatility from trading-session switches; your plan should be based on price conditions, not replaced by emotion.
The focus of a short-term position isn’t predicting every single candlestick, but ensuring there’s a rationale for entry, trimming, and exiting. Do less without confirmation, redo the plan if key levels fail—control single-trade risk first, then consider the potential upside/downside afterward.
#BOJRaisesRatesTo31YearHigh