Trading Ideas|9/20 15:20
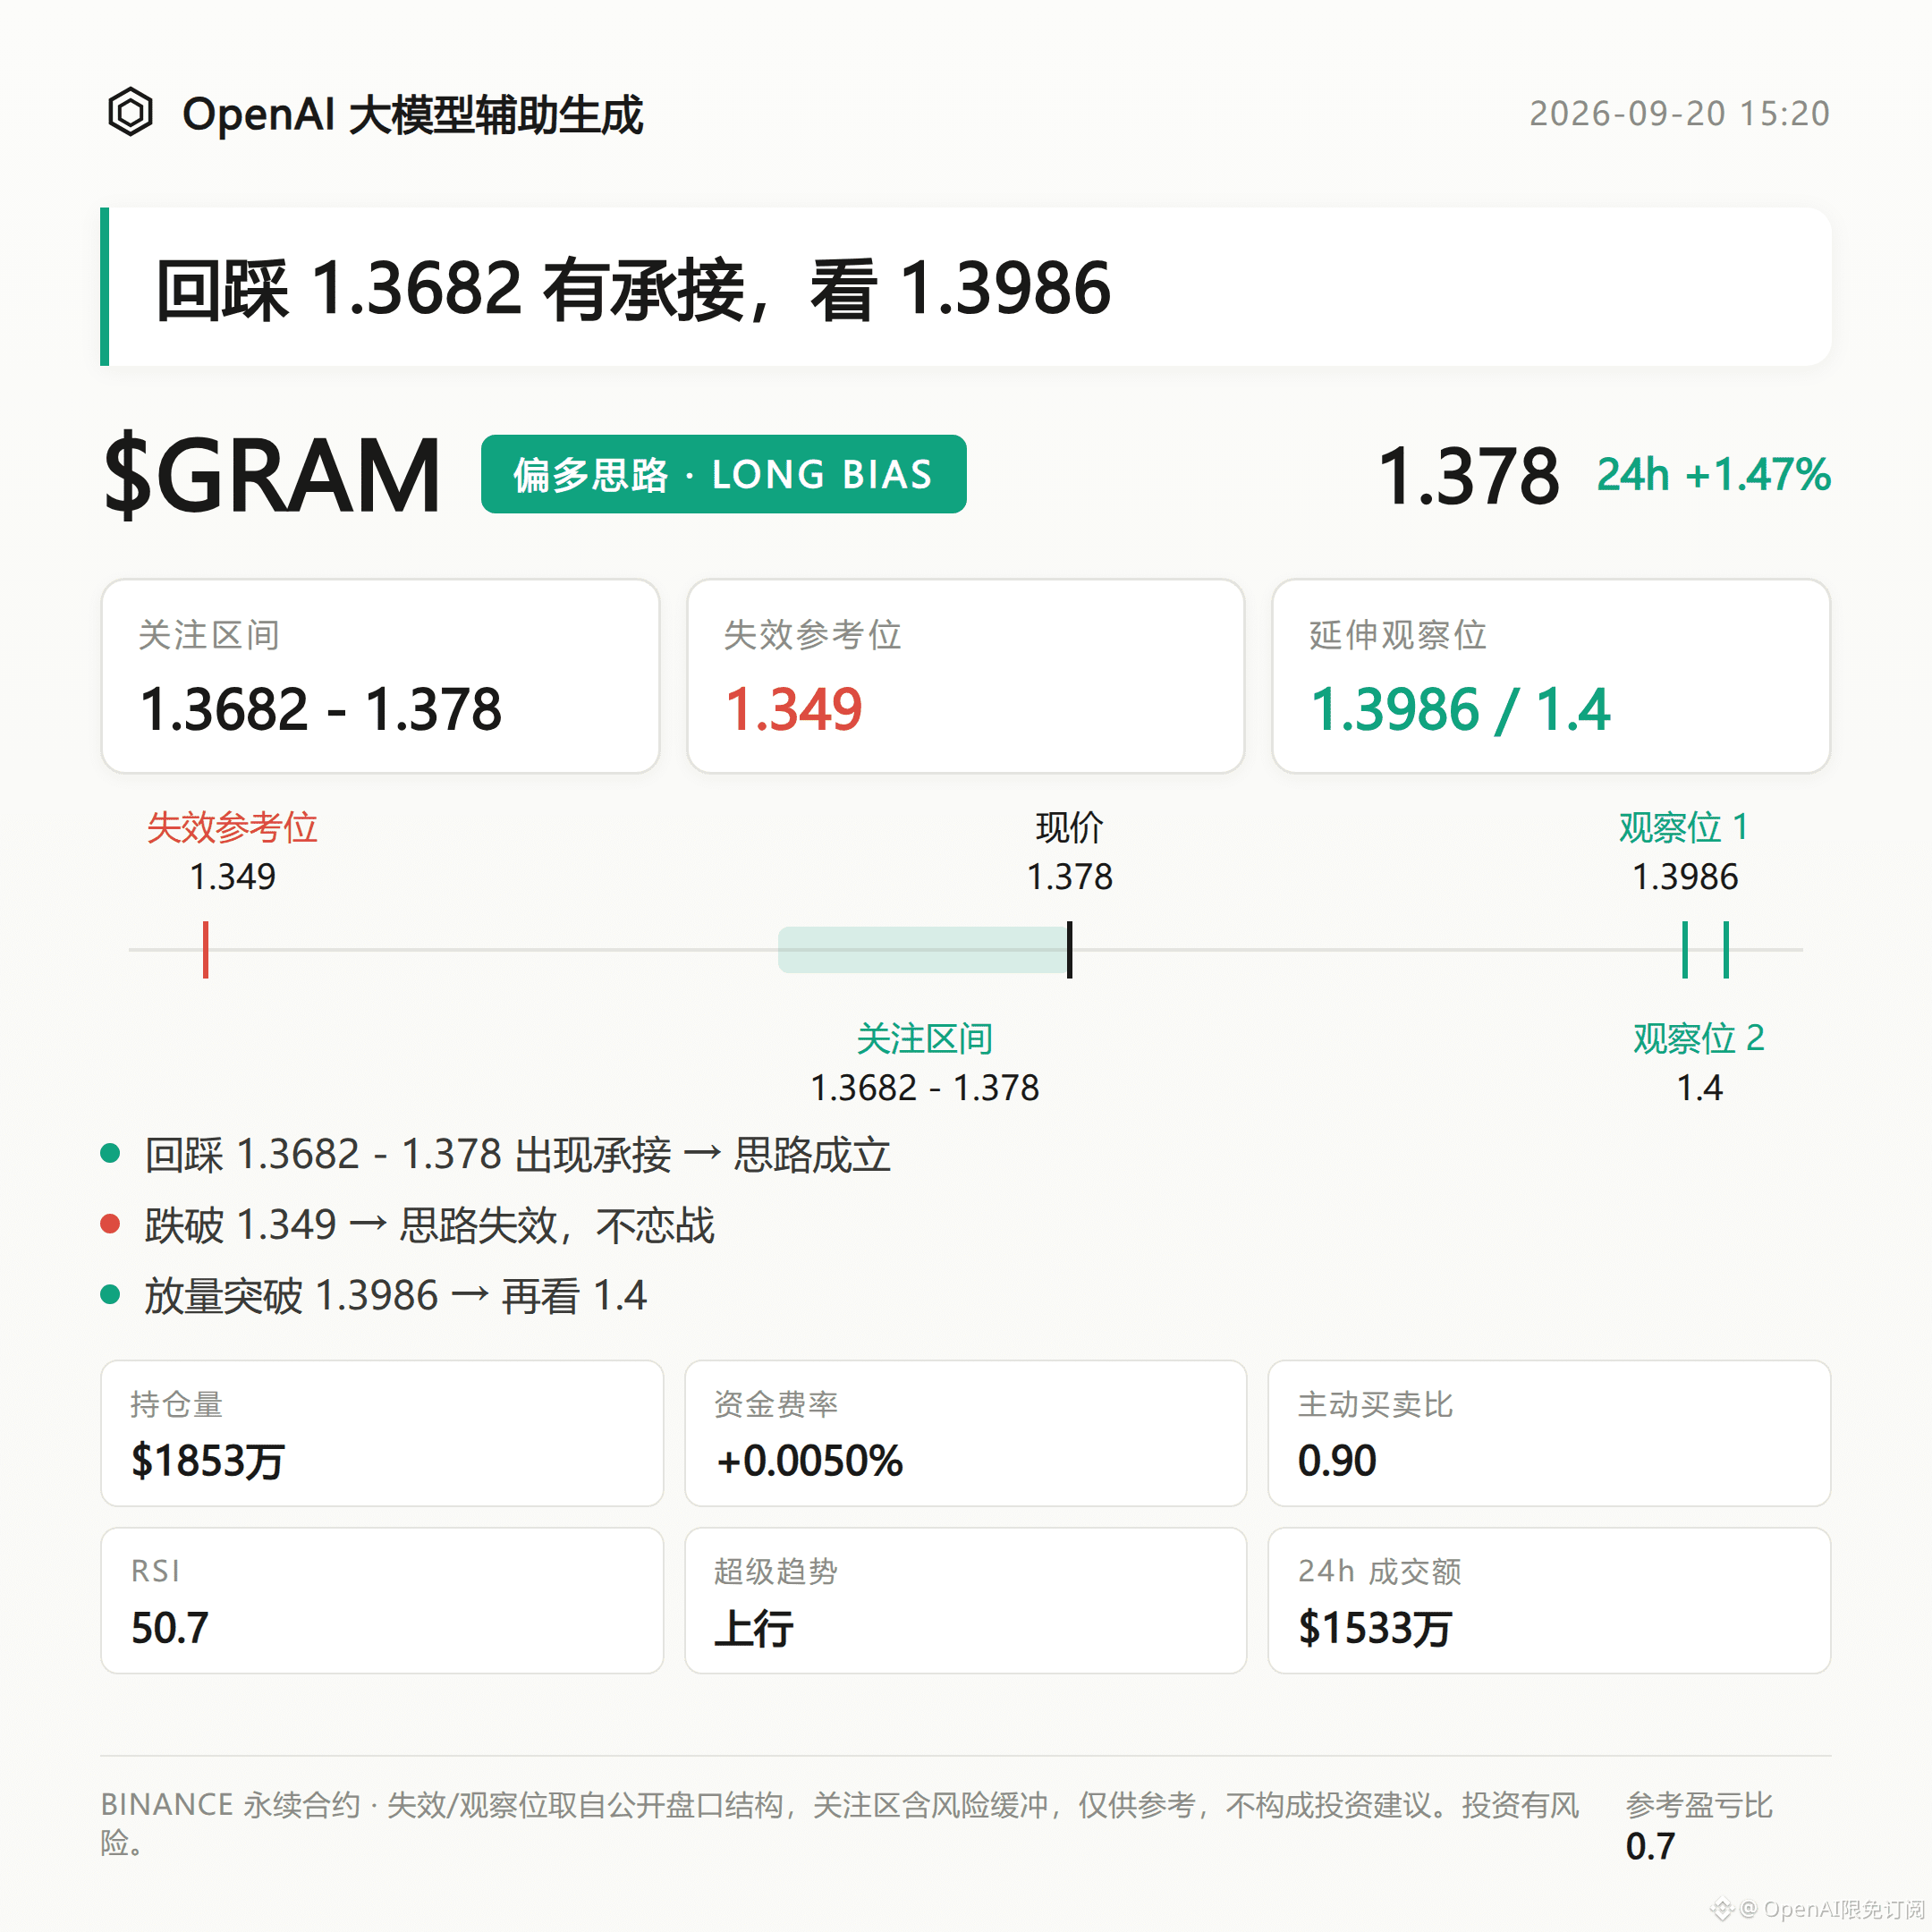
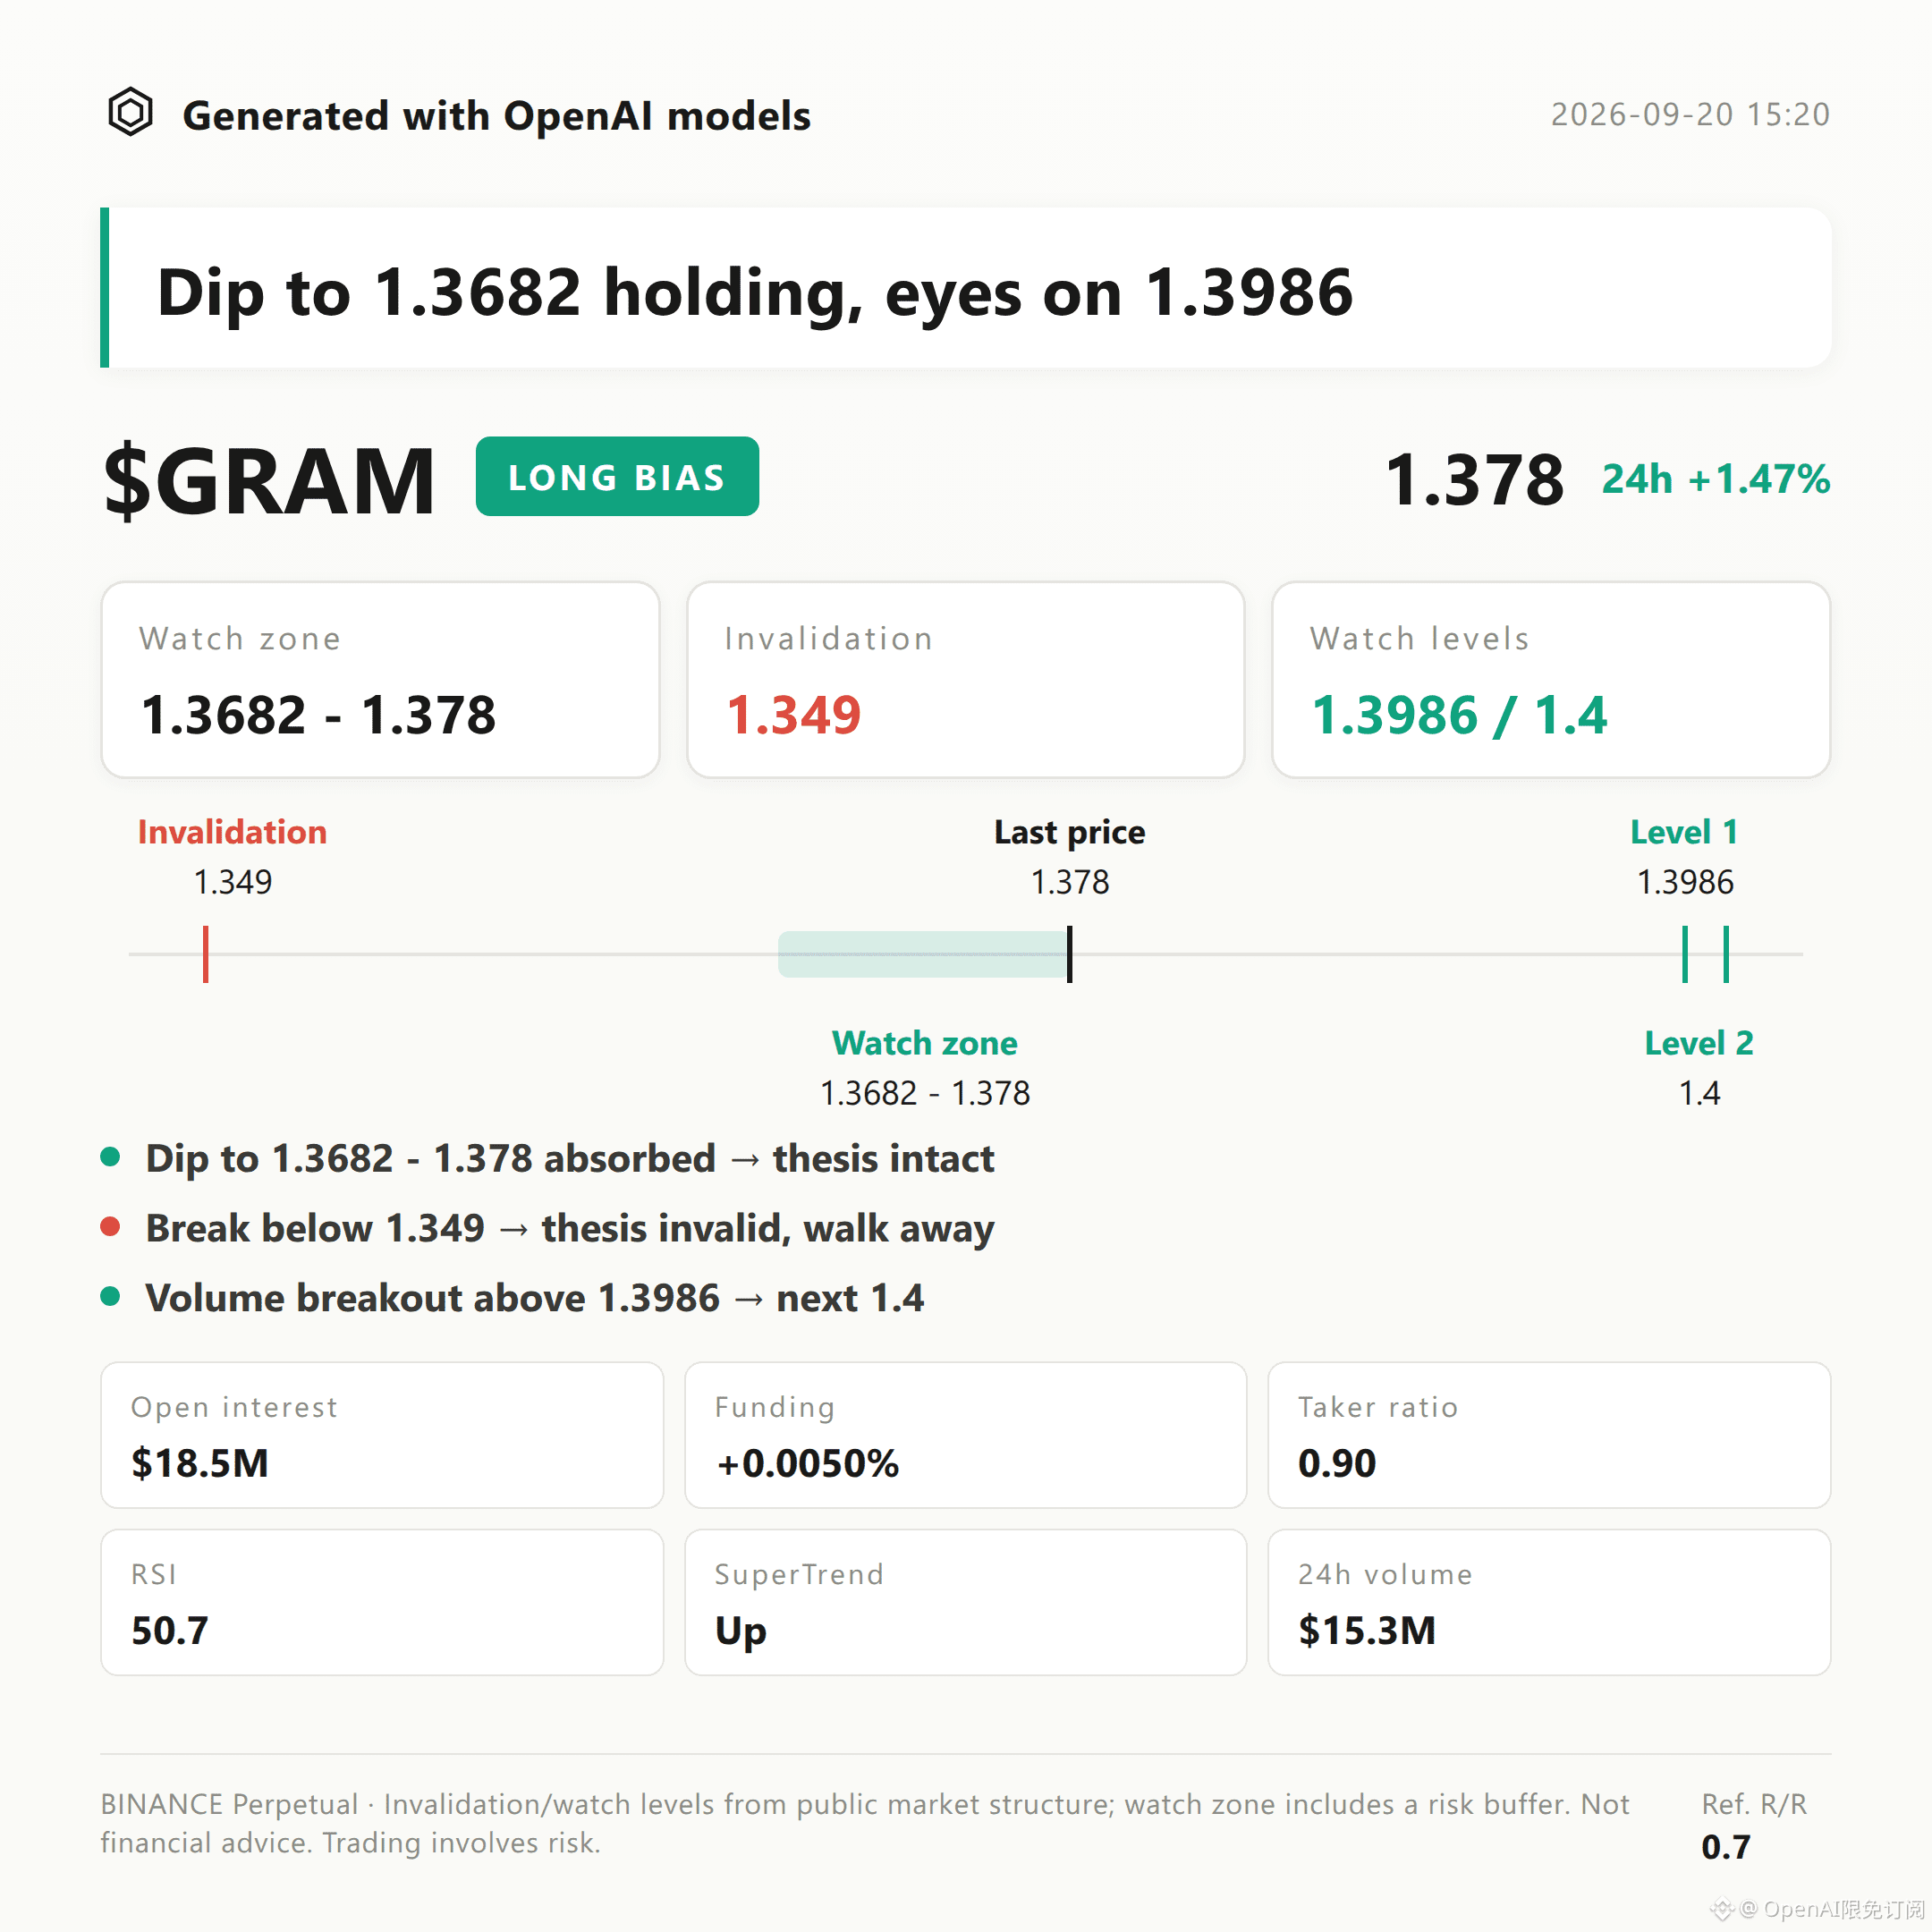
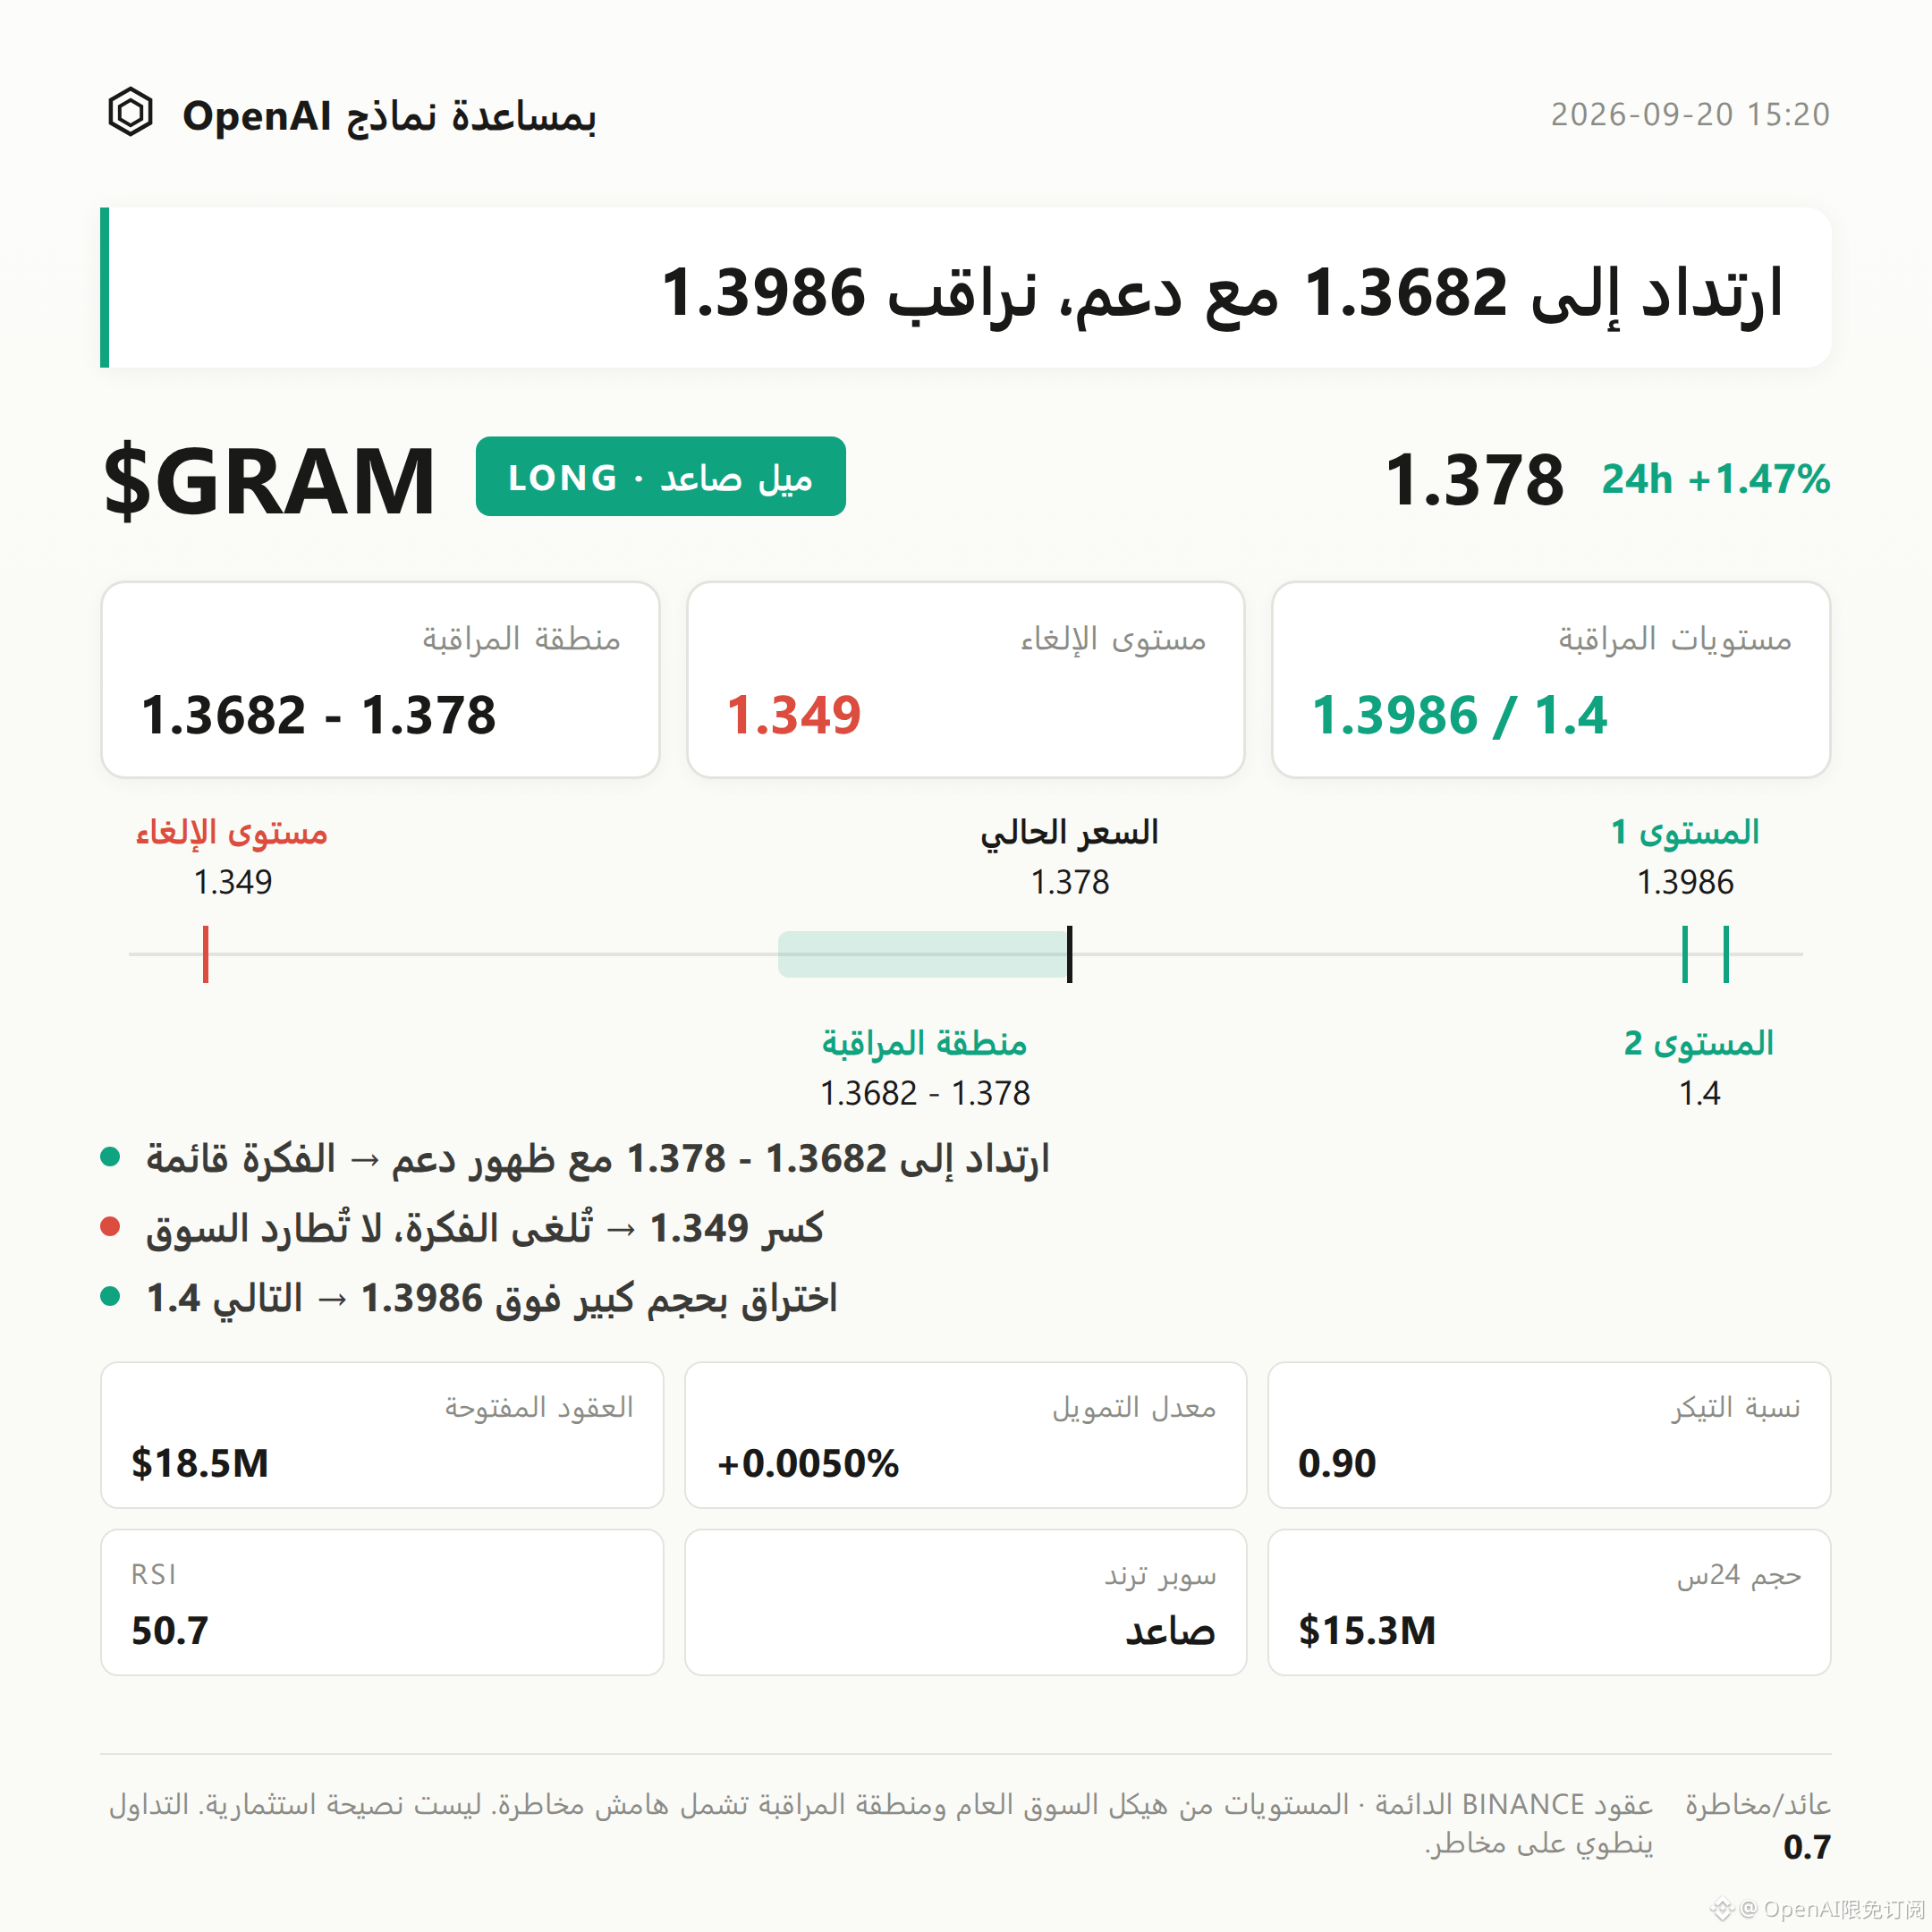
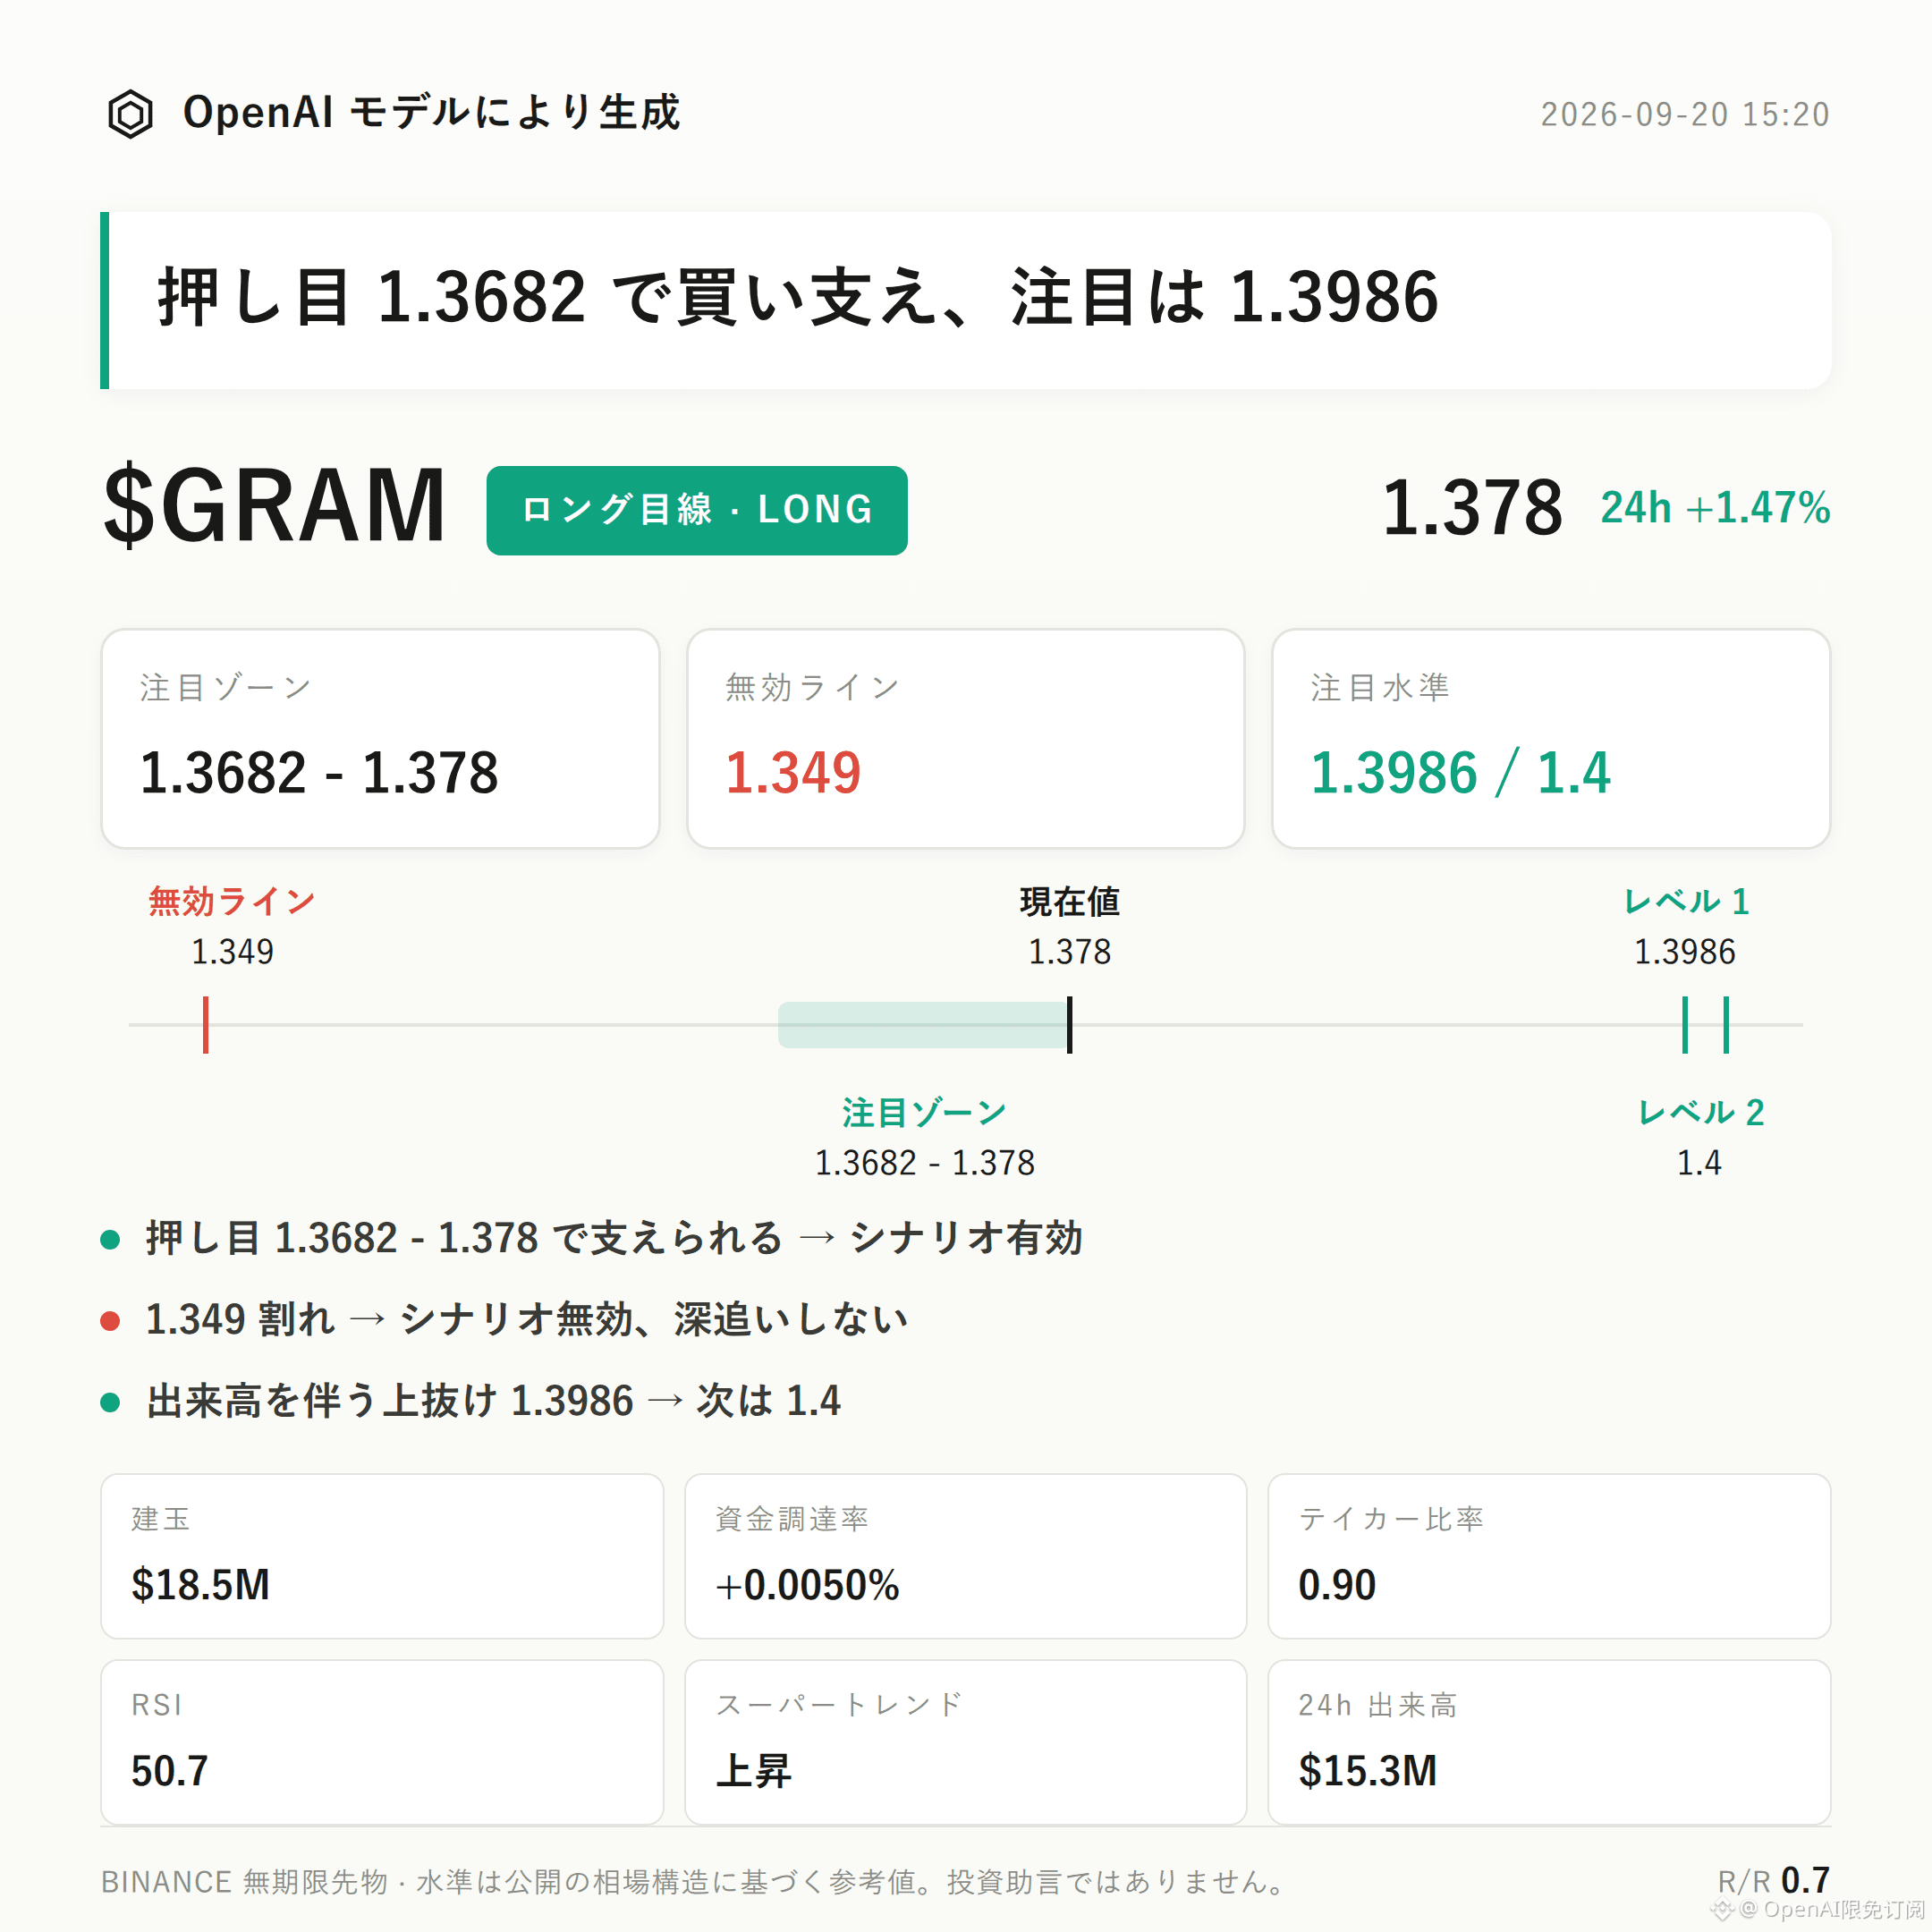
$GRAM is leaning bullish. | Watch Range 1.3682 - 1.378 | Invalidation Reference 1.349 | Observation Levels 1.3986 / 1.4
$GRAM ’s current bullish structure is playing out.
The core thesis rests on three points: the Supertrend remains upward, the MACD shows bullish momentum, and in the past 24 hours the price has followed through with a 1.47% rise—these three are aligned in direction.
The key for further confirmation is whether the long reference zone 1.3682-1.378 can continue to provide support.
From a technical structure perspective: the recent high is 1.4, the recent low is 1.349, and the current price at 1.378 sits in the upper half of the range.
The Bollinger Band midline is 1.3834, the upper band is 1.3986, and the lower band is 1.3682. The current price is slightly below the midline, and the upper band expansion space has not opened yet.
RSI is 50.7, staying in a healthy range—neither overheated nor showing weakness.
MACD maintains bullish momentum, and the Supertrend direction is up, which cross-validates the price structure.
In derivatives data: the past 24h trading volume is $15.33 million, open interest is $18.53 million, and the 24h change is -0.8%, indicating open interest has not increased in sync.
Funding rate is +0.0050%, meaning the long side’s cost is extremely low.
For the long-vs-short account ratio, longs account for 60%, showing sentiment is relatively bullish.
However, the active buy/sell ratio is 0.90, suggesting buy pressure is not dominant and the inclination to chase prices in the short term is limited—this slightly diverges from the bullish structure and needs attention.
Reference levels can be monitored conditionally:
- If price pulls back to 1.3682-1.378 and then shows signs of support, the bullish idea may be considered valid on a stage-by-stage basis.
- If price breaks below 1.349, it means the current push-up structure is broken; the bullish idea is invalid and should not be viewed the same way going forward.
- If price breaks upward with volume above 1.3986, you can watch how it behaves near 1.4 as resistance—whether it can hold determines whether there is potential for further extension.
Be objective about the downside risk: the active buy/sell ratio of 0.90 indicates buys are not clearly dominant. The current upward momentum comes more from trend indicators than from active trade-driven demand, so there is a possibility of structural back-and-forth.
Also, the reference risk-reward ratio is 0.7, which is relatively low—meaning even if the structure holds, the risk-reward is not very comfortable, and it does not provide strong backing for any one-way direction.
With contract leverage, position discipline is more important than directional judgment.
For reference only; this is not investment advice. Contracts have leverage—investing involves risk.
This article was generated with assistance from an OpenAI large model.
$GRAM
#Contract Analysis
$GRAM is leaning bullish. | Watch Range 1.3682 - 1.378 | Invalidation Reference 1.349 | Observation Levels 1.3986 / 1.4
$GRAM ’s current bullish structure is playing out.
The core thesis rests on three points: the Supertrend remains upward, the MACD shows bullish momentum, and in the past 24 hours the price has followed through with a 1.47% rise—these three are aligned in direction.
The key for further confirmation is whether the long reference zone 1.3682-1.378 can continue to provide support.
From a technical structure perspective: the recent high is 1.4, the recent low is 1.349, and the current price at 1.378 sits in the upper half of the range.
The Bollinger Band midline is 1.3834, the upper band is 1.3986, and the lower band is 1.3682. The current price is slightly below the midline, and the upper band expansion space has not opened yet.
RSI is 50.7, staying in a healthy range—neither overheated nor showing weakness.
MACD maintains bullish momentum, and the Supertrend direction is up, which cross-validates the price structure.
In derivatives data: the past 24h trading volume is $15.33 million, open interest is $18.53 million, and the 24h change is -0.8%, indicating open interest has not increased in sync.
Funding rate is +0.0050%, meaning the long side’s cost is extremely low.
For the long-vs-short account ratio, longs account for 60%, showing sentiment is relatively bullish.
However, the active buy/sell ratio is 0.90, suggesting buy pressure is not dominant and the inclination to chase prices in the short term is limited—this slightly diverges from the bullish structure and needs attention.
Reference levels can be monitored conditionally:
- If price pulls back to 1.3682-1.378 and then shows signs of support, the bullish idea may be considered valid on a stage-by-stage basis.
- If price breaks below 1.349, it means the current push-up structure is broken; the bullish idea is invalid and should not be viewed the same way going forward.
- If price breaks upward with volume above 1.3986, you can watch how it behaves near 1.4 as resistance—whether it can hold determines whether there is potential for further extension.
Be objective about the downside risk: the active buy/sell ratio of 0.90 indicates buys are not clearly dominant. The current upward momentum comes more from trend indicators than from active trade-driven demand, so there is a possibility of structural back-and-forth.
Also, the reference risk-reward ratio is 0.7, which is relatively low—meaning even if the structure holds, the risk-reward is not very comfortable, and it does not provide strong backing for any one-way direction.
With contract leverage, position discipline is more important than directional judgment.
For reference only; this is not investment advice. Contracts have leverage—investing involves risk.
This article was generated with assistance from an OpenAI large model.
$GRAM
#Contract Analysis