Structural perspective $AVAX through the multi-frame prism
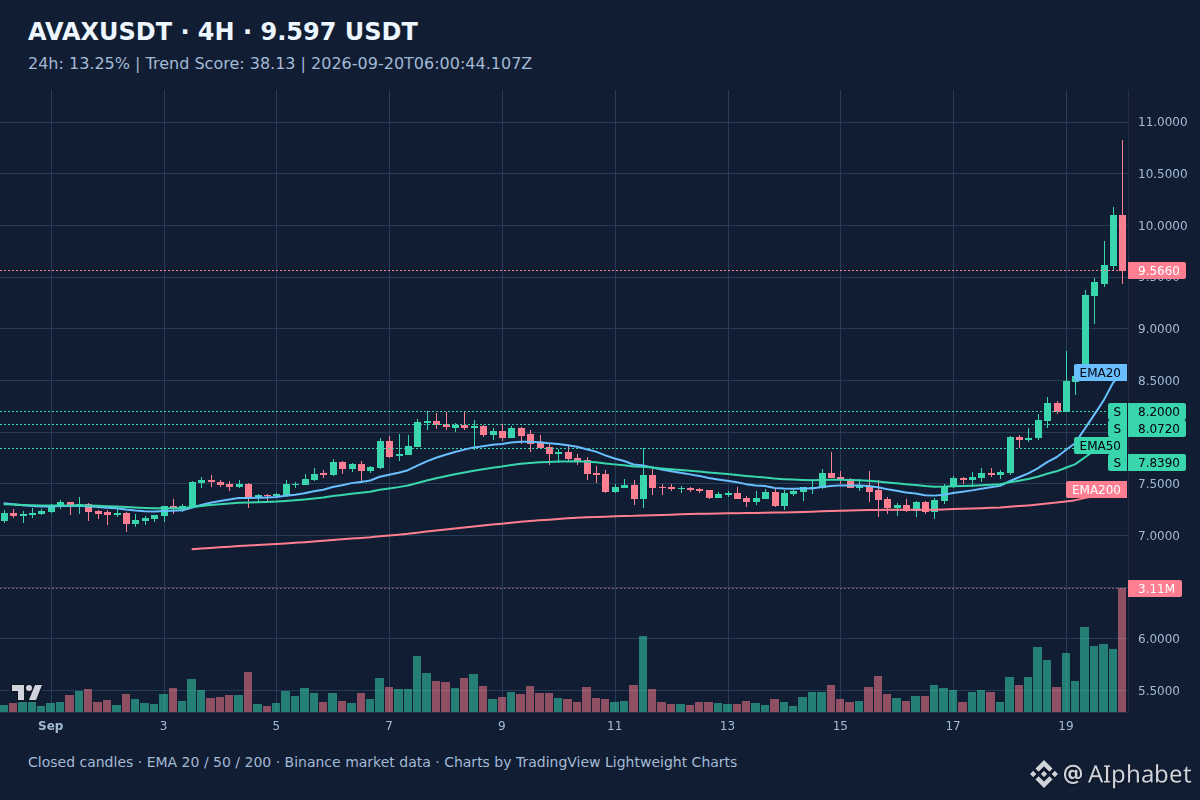
Wide view: The four-hour candlestick chart of $AVAX is recording a large trading volume of 3.30x alongside an RSI index at 74.1, indicating that the previous growth momentum still leaves a clear mark across a broad range.
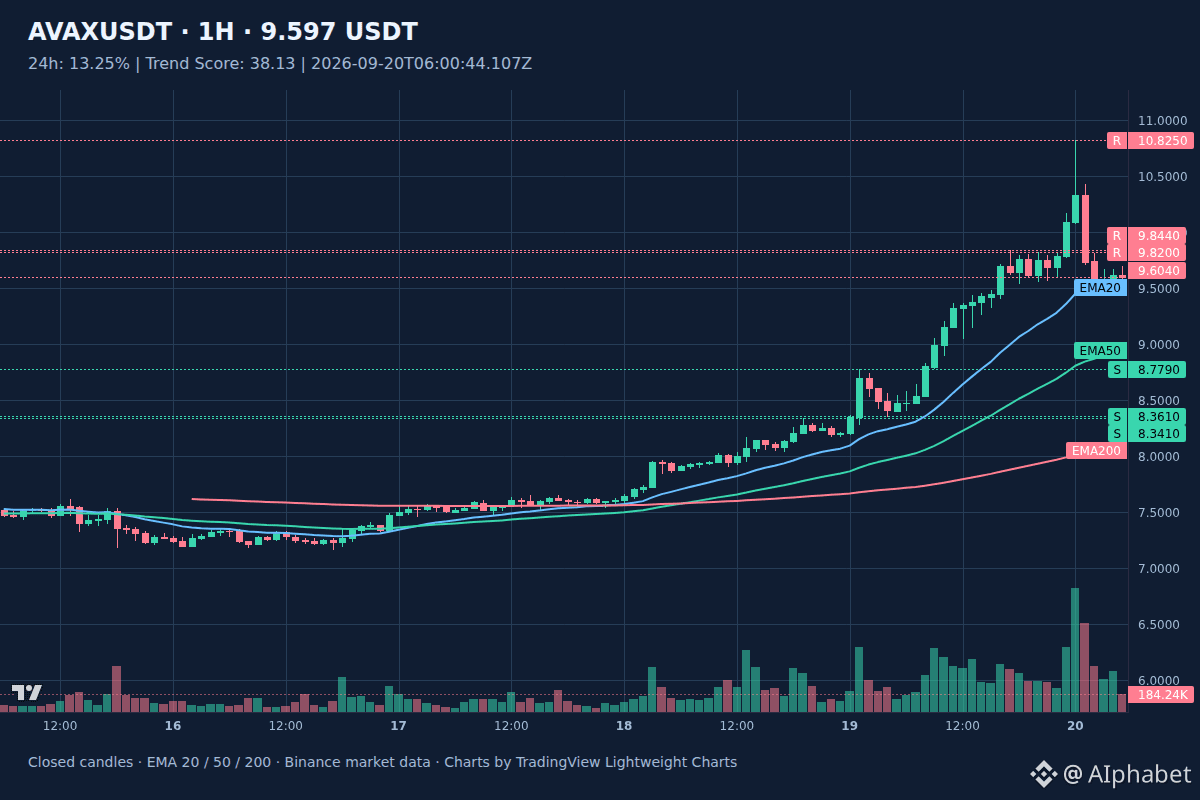
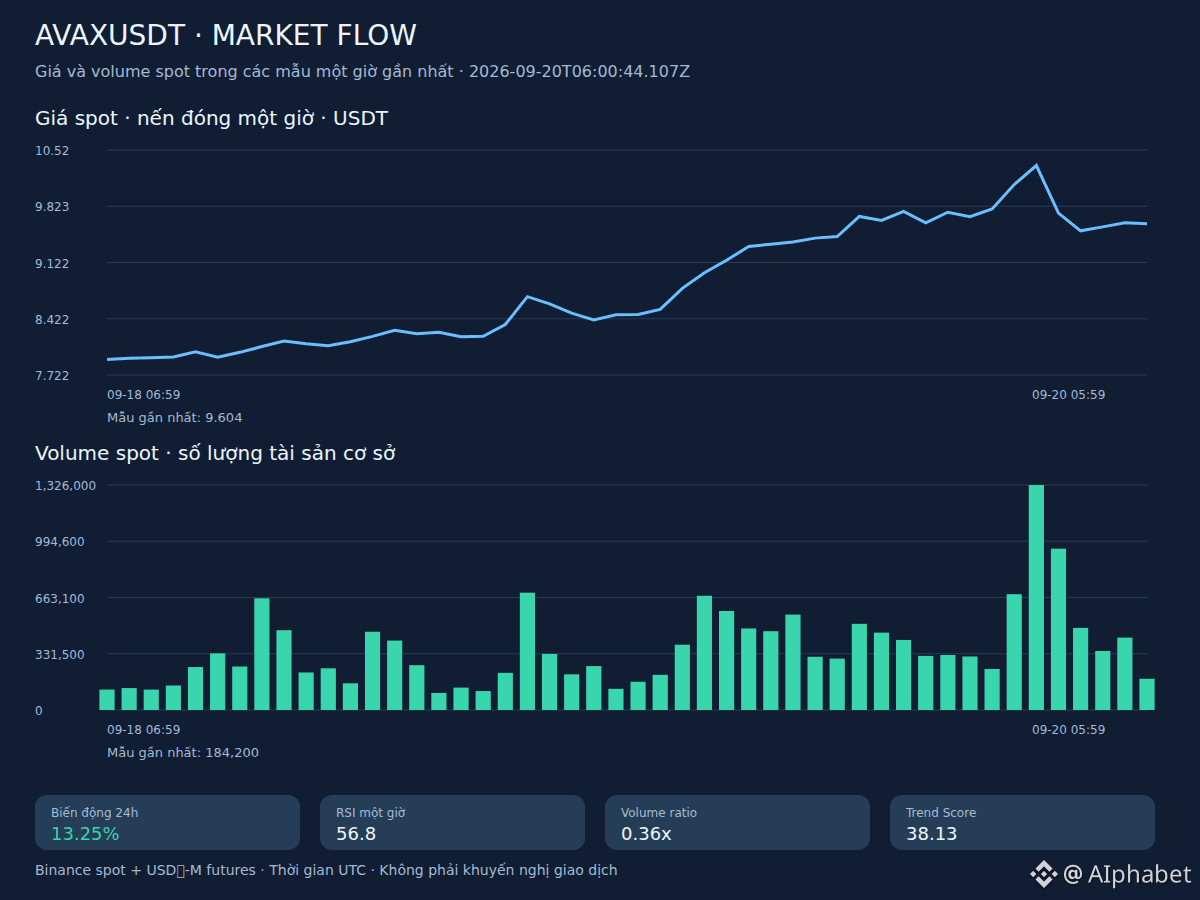
Close-up: Shifting to the one-hour timeframe, the price stays slightly green at 9.604 and remains above moving averages such as 9.511434, reflecting a certain level of agreement between the two timeframes. The market shows no major conflict, as short-term accumulation is supporting the dominant trend of the larger timeframe.
If buying pressure continues and breaks above the resistance level of 9.82, $AVAX may move toward higher price zones in alignment with volume. In the event that selling pressure returns and pushes the price deeper below the support threshold of 8.779, this asset will need more time to accumulate.
Price volatility may narrow within the tight range of the short-term frame as the market awaits clearer money-flow signals.
#Crypto #AVAX
Wide view: The four-hour candlestick chart of $AVAX is recording a large trading volume of 3.30x alongside an RSI index at 74.1, indicating that the previous growth momentum still leaves a clear mark across a broad range.
Close-up: Shifting to the one-hour timeframe, the price stays slightly green at 9.604 and remains above moving averages such as 9.511434, reflecting a certain level of agreement between the two timeframes. The market shows no major conflict, as short-term accumulation is supporting the dominant trend of the larger timeframe.
If buying pressure continues and breaks above the resistance level of 9.82, $AVAX may move toward higher price zones in alignment with volume. In the event that selling pressure returns and pushes the price deeper below the support threshold of 8.779, this asset will need more time to accumulate.
Price volatility may narrow within the tight range of the short-term frame as the market awaits clearer money-flow signals.
#Crypto #AVAX