🚀 Ethereum is in a correction phase: entry opportunity or a technical pause? ⚡
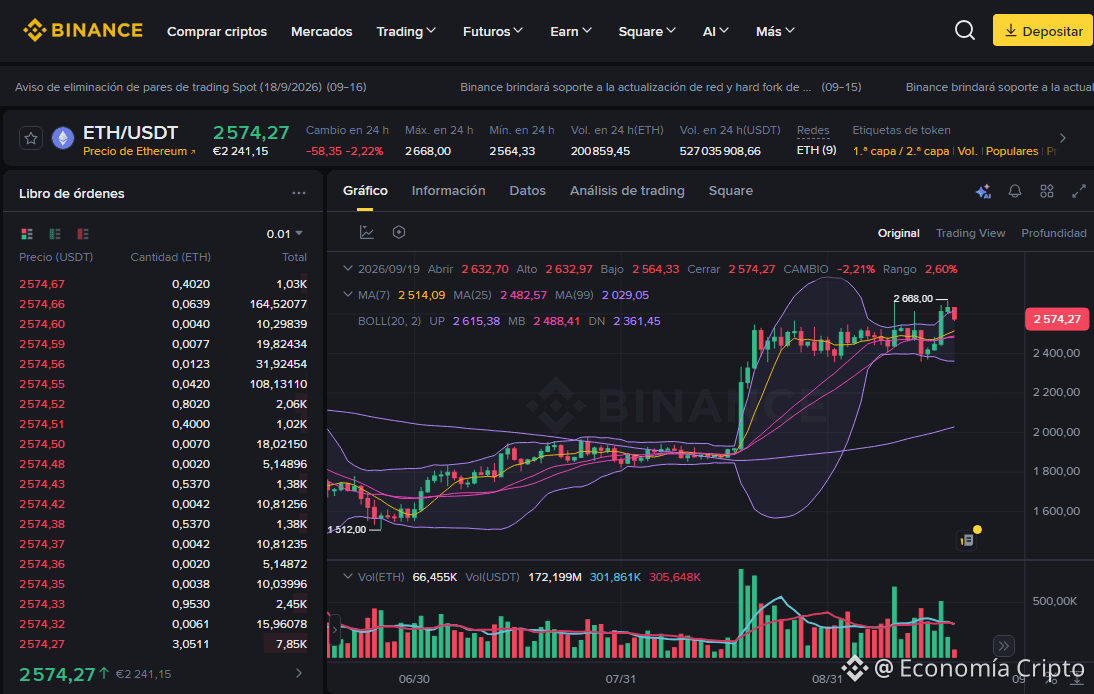
The ETH/USDT pair is trading at 2,574.27, recording a -2.22% correction over the last 24 hours. The daily session shows an open at 2,632.70, a high of 2,632.97, a low of 2,564.33, and a -2.21% adjustment, reflecting a healthy breather after testing the recent highs at 2,668.00.
🔍 Trend Analysis and Indicators
Trend: Bullish underlying trend with a temporary short-term pullback, while keeping the market’s overall structure intact.
Moving Averages: The price remains solidly above the MA(7) (2,514.09) and the MA(25) (2,482.57). Meanwhile, the long-term macro trend stays firmly bullish, as it is trading well above the MA(99) (2,029.05).
Bollinger Bands: Price is retreating from the upper zone and looking for support toward the middle band MB (2,488.41), with the upper band at UP (2,615.38) and the lower band at DN (2,361.45). This indicates a rebalancing of volatility after the previous impulse.
Key Levels: Immediate support is located at the session low of 2,564, while the main resistance to break is found at the highs of 2,668.
💡 Trading Strategy: Buy or Sell?
Buy (Long)?: This controlled pullback offers an interesting tactical opportunity for accumulation to position in favor of the main trend, managing risk with a Stop Loss set below the moving averages.
Sell (Short)?: Trading to the downside carries high risk because it goes against the macro structure; it would only be considered in the event of a sustained loss of the key supports.
#Ethereum #AnalisisTecnico #CryptoTrading
May the Lord bless and prosper whoever operates here, in the name of Jesus, since your word says: "Mine is the silver, and mine is the gold," says the LORD of hosts. Hageo 2:8 RV1960-T -
$ETH
The ETH/USDT pair is trading at 2,574.27, recording a -2.22% correction over the last 24 hours. The daily session shows an open at 2,632.70, a high of 2,632.97, a low of 2,564.33, and a -2.21% adjustment, reflecting a healthy breather after testing the recent highs at 2,668.00.
🔍 Trend Analysis and Indicators
Trend: Bullish underlying trend with a temporary short-term pullback, while keeping the market’s overall structure intact.
Moving Averages: The price remains solidly above the MA(7) (2,514.09) and the MA(25) (2,482.57). Meanwhile, the long-term macro trend stays firmly bullish, as it is trading well above the MA(99) (2,029.05).
Bollinger Bands: Price is retreating from the upper zone and looking for support toward the middle band MB (2,488.41), with the upper band at UP (2,615.38) and the lower band at DN (2,361.45). This indicates a rebalancing of volatility after the previous impulse.
Key Levels: Immediate support is located at the session low of 2,564, while the main resistance to break is found at the highs of 2,668.
💡 Trading Strategy: Buy or Sell?
Buy (Long)?: This controlled pullback offers an interesting tactical opportunity for accumulation to position in favor of the main trend, managing risk with a Stop Loss set below the moving averages.
Sell (Short)?: Trading to the downside carries high risk because it goes against the macro structure; it would only be considered in the event of a sustained loss of the key supports.
#Ethereum #AnalisisTecnico #CryptoTrading
May the Lord bless and prosper whoever operates here, in the name of Jesus, since your word says: "Mine is the silver, and mine is the gold," says the LORD of hosts. Hageo 2:8 RV1960-T -
$ETH