📊 Want to Find Better Stock Setups?
Investing shouldn’t be based on gut feelings or hype. A stronger approach is to combine fundamental + technical analysis.
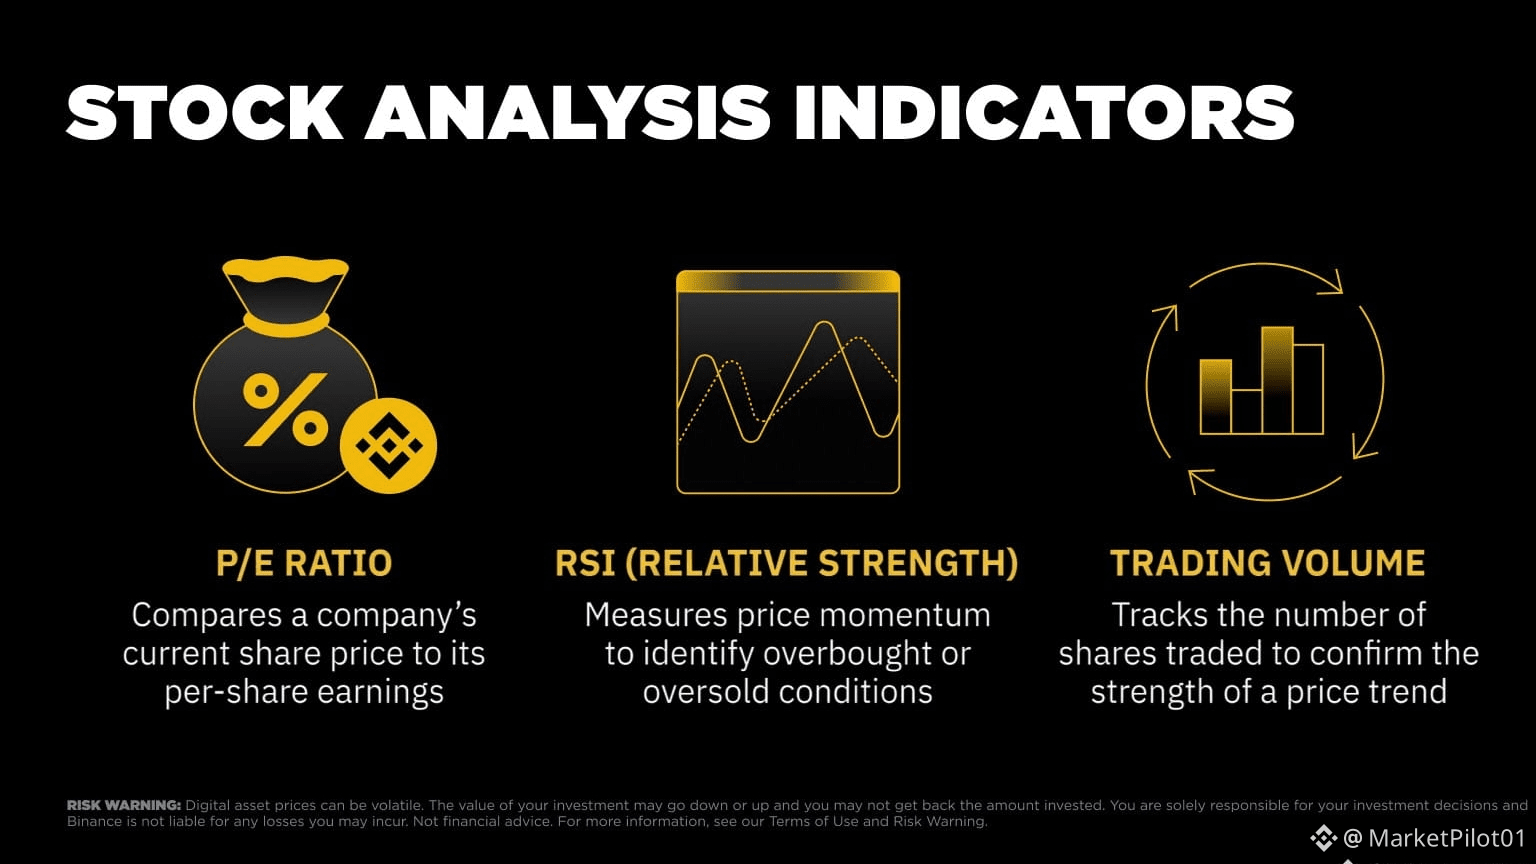
Here are 3 metrics worth understanding:
👉 P/E Ratio
Compares a company’s share price with its earnings per share. A high P/E can reflect strong growth expectations, while a low P/E may indicate a lower valuation—but context matters.
👉 RSI
A momentum indicator ranging from 0–100. RSI above 70 is commonly viewed as overbought, while below 30 is commonly viewed as oversold. These levels are signals to investigate, not guaranteed reversals.
👉 Trading Volume
Volume helps show how much participation is behind a price move. Strong volume can add confirmation to a breakout, while low-volume moves may deserve extra caution.
📌 Don’t rely on one indicator. Understand the bigger picture.
DYOR. Manage your risk. 🛡️
#Stocks #Investing #Trading #TechnicalAnalysis #BinanceSquare
Investing shouldn’t be based on gut feelings or hype. A stronger approach is to combine fundamental + technical analysis.
Here are 3 metrics worth understanding:
👉 P/E Ratio
Compares a company’s share price with its earnings per share. A high P/E can reflect strong growth expectations, while a low P/E may indicate a lower valuation—but context matters.
👉 RSI
A momentum indicator ranging from 0–100. RSI above 70 is commonly viewed as overbought, while below 30 is commonly viewed as oversold. These levels are signals to investigate, not guaranteed reversals.
👉 Trading Volume
Volume helps show how much participation is behind a price move. Strong volume can add confirmation to a breakout, while low-volume moves may deserve extra caution.
📌 Don’t rely on one indicator. Understand the bigger picture.
DYOR. Manage your risk. 🛡️
#Stocks #Investing #Trading #TechnicalAnalysis #BinanceSquare