Trading Ideas|9/20 12:21
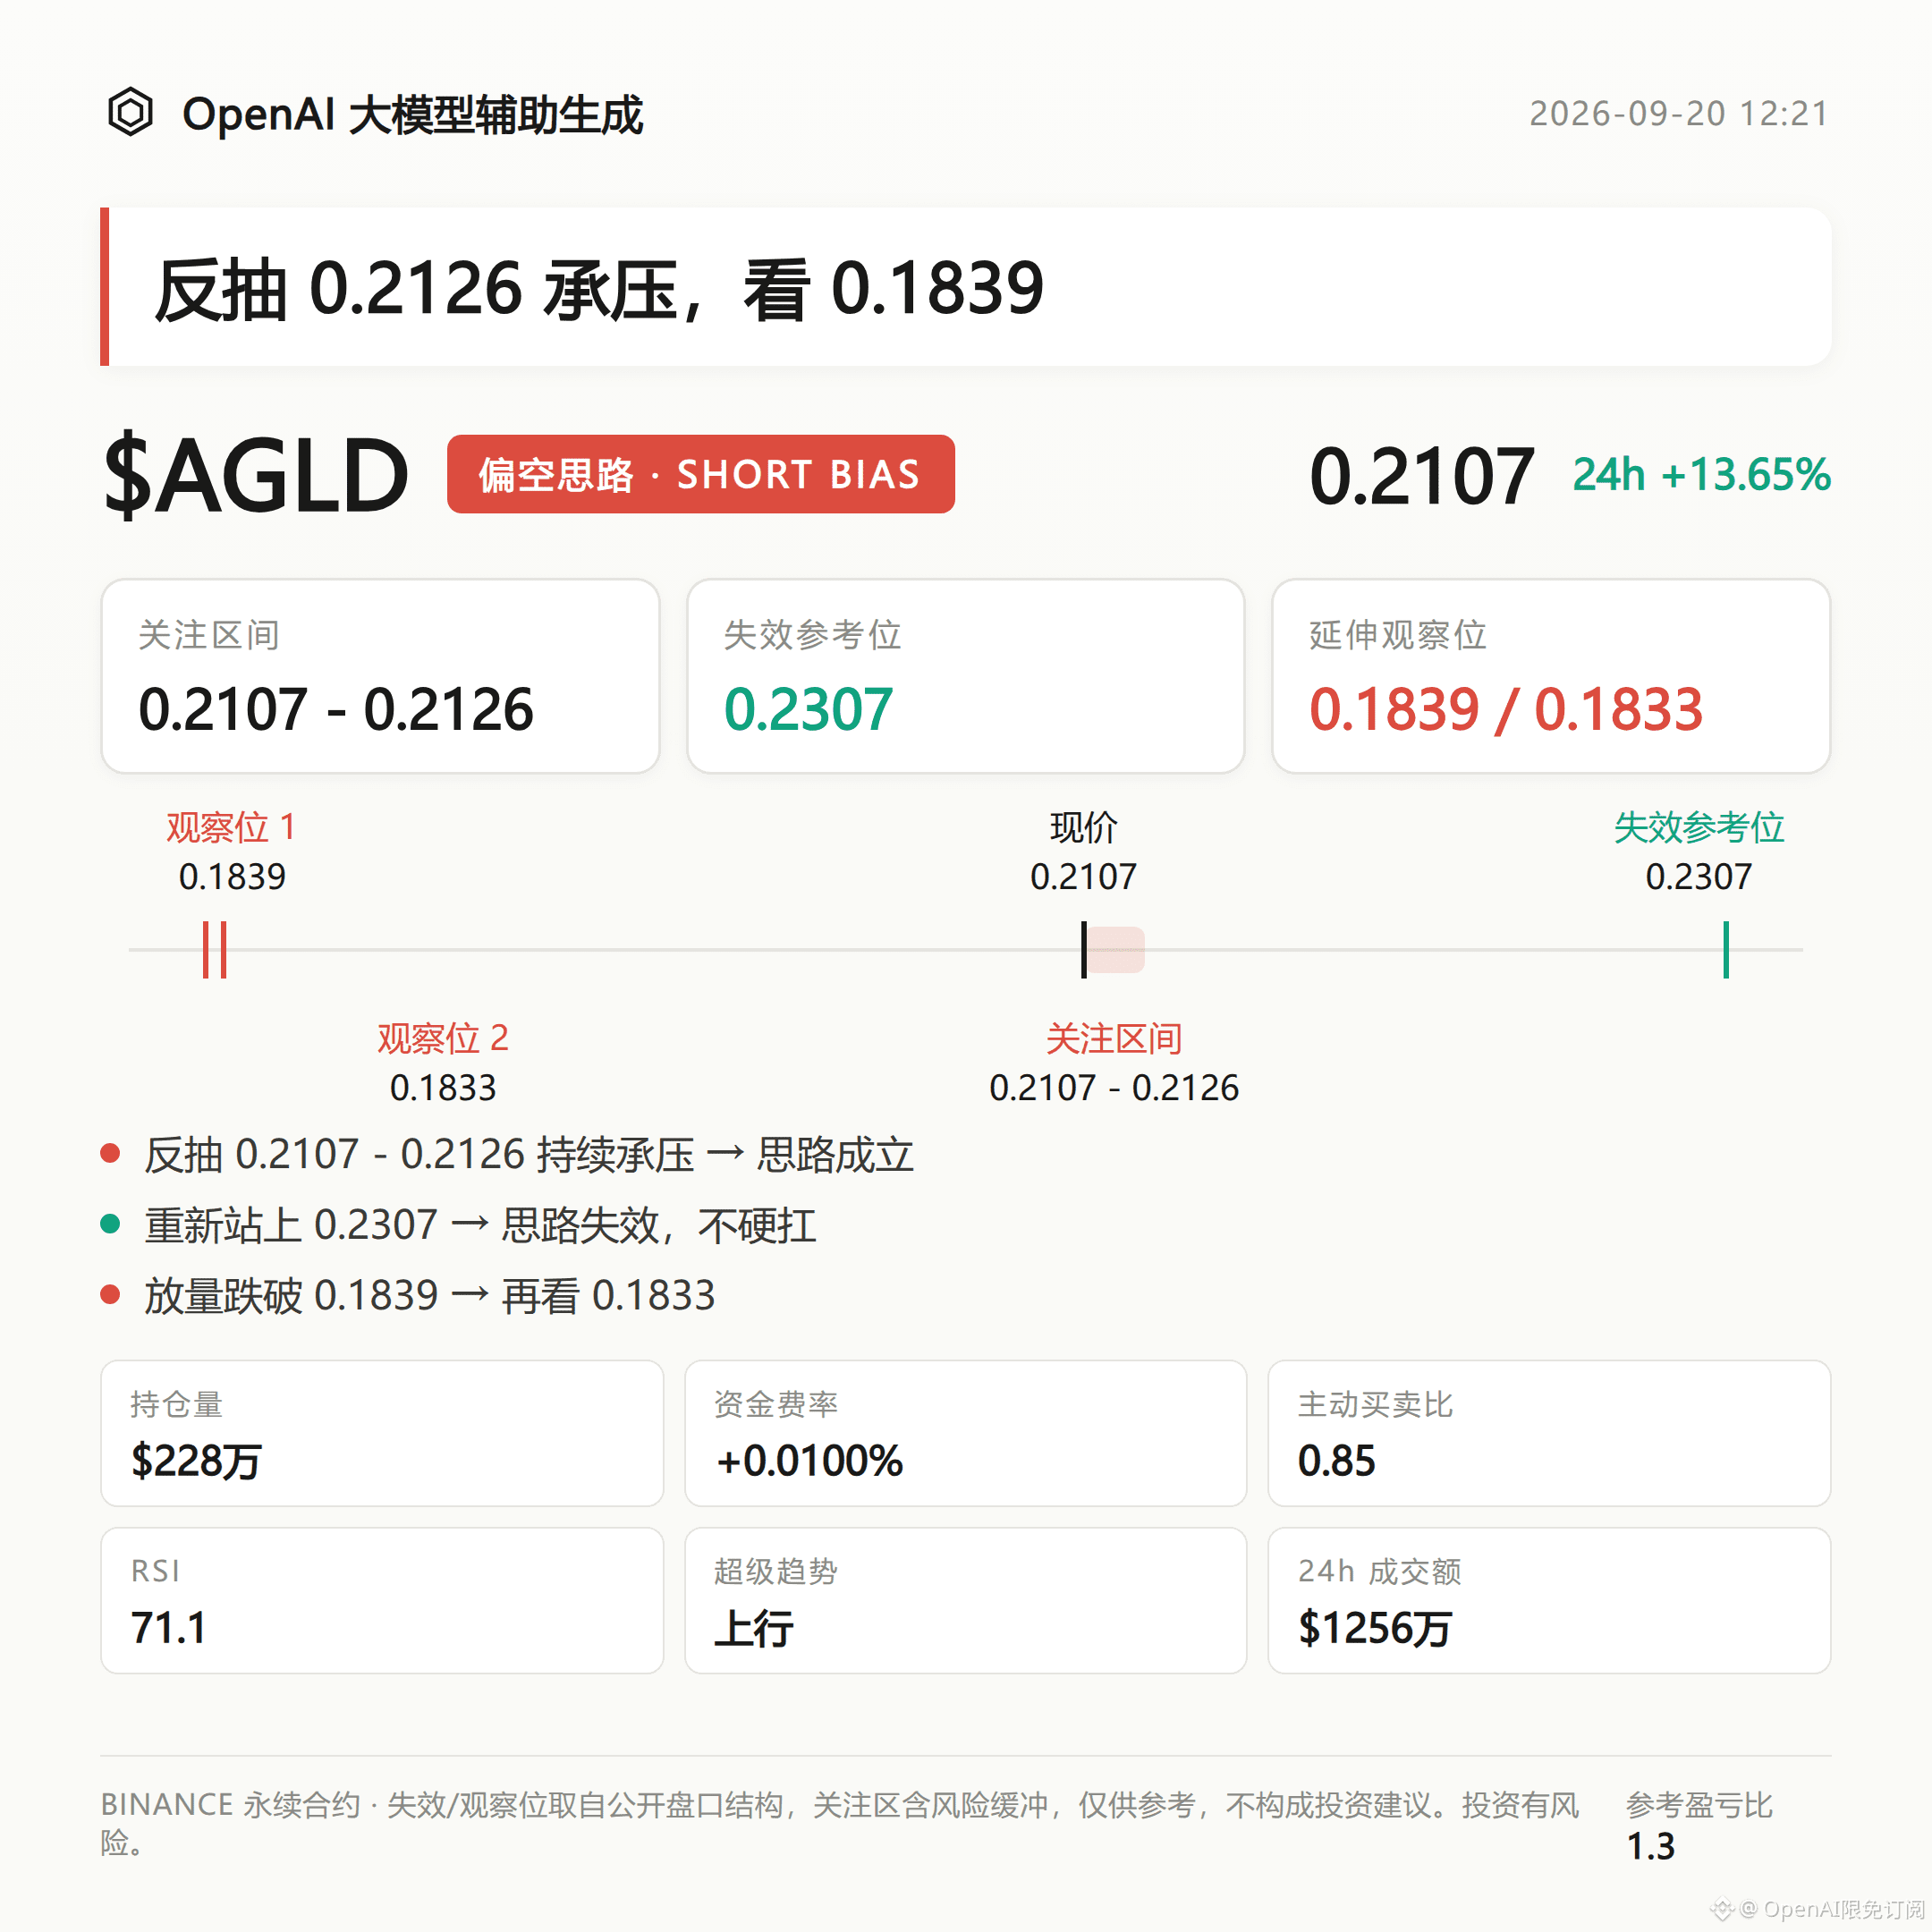
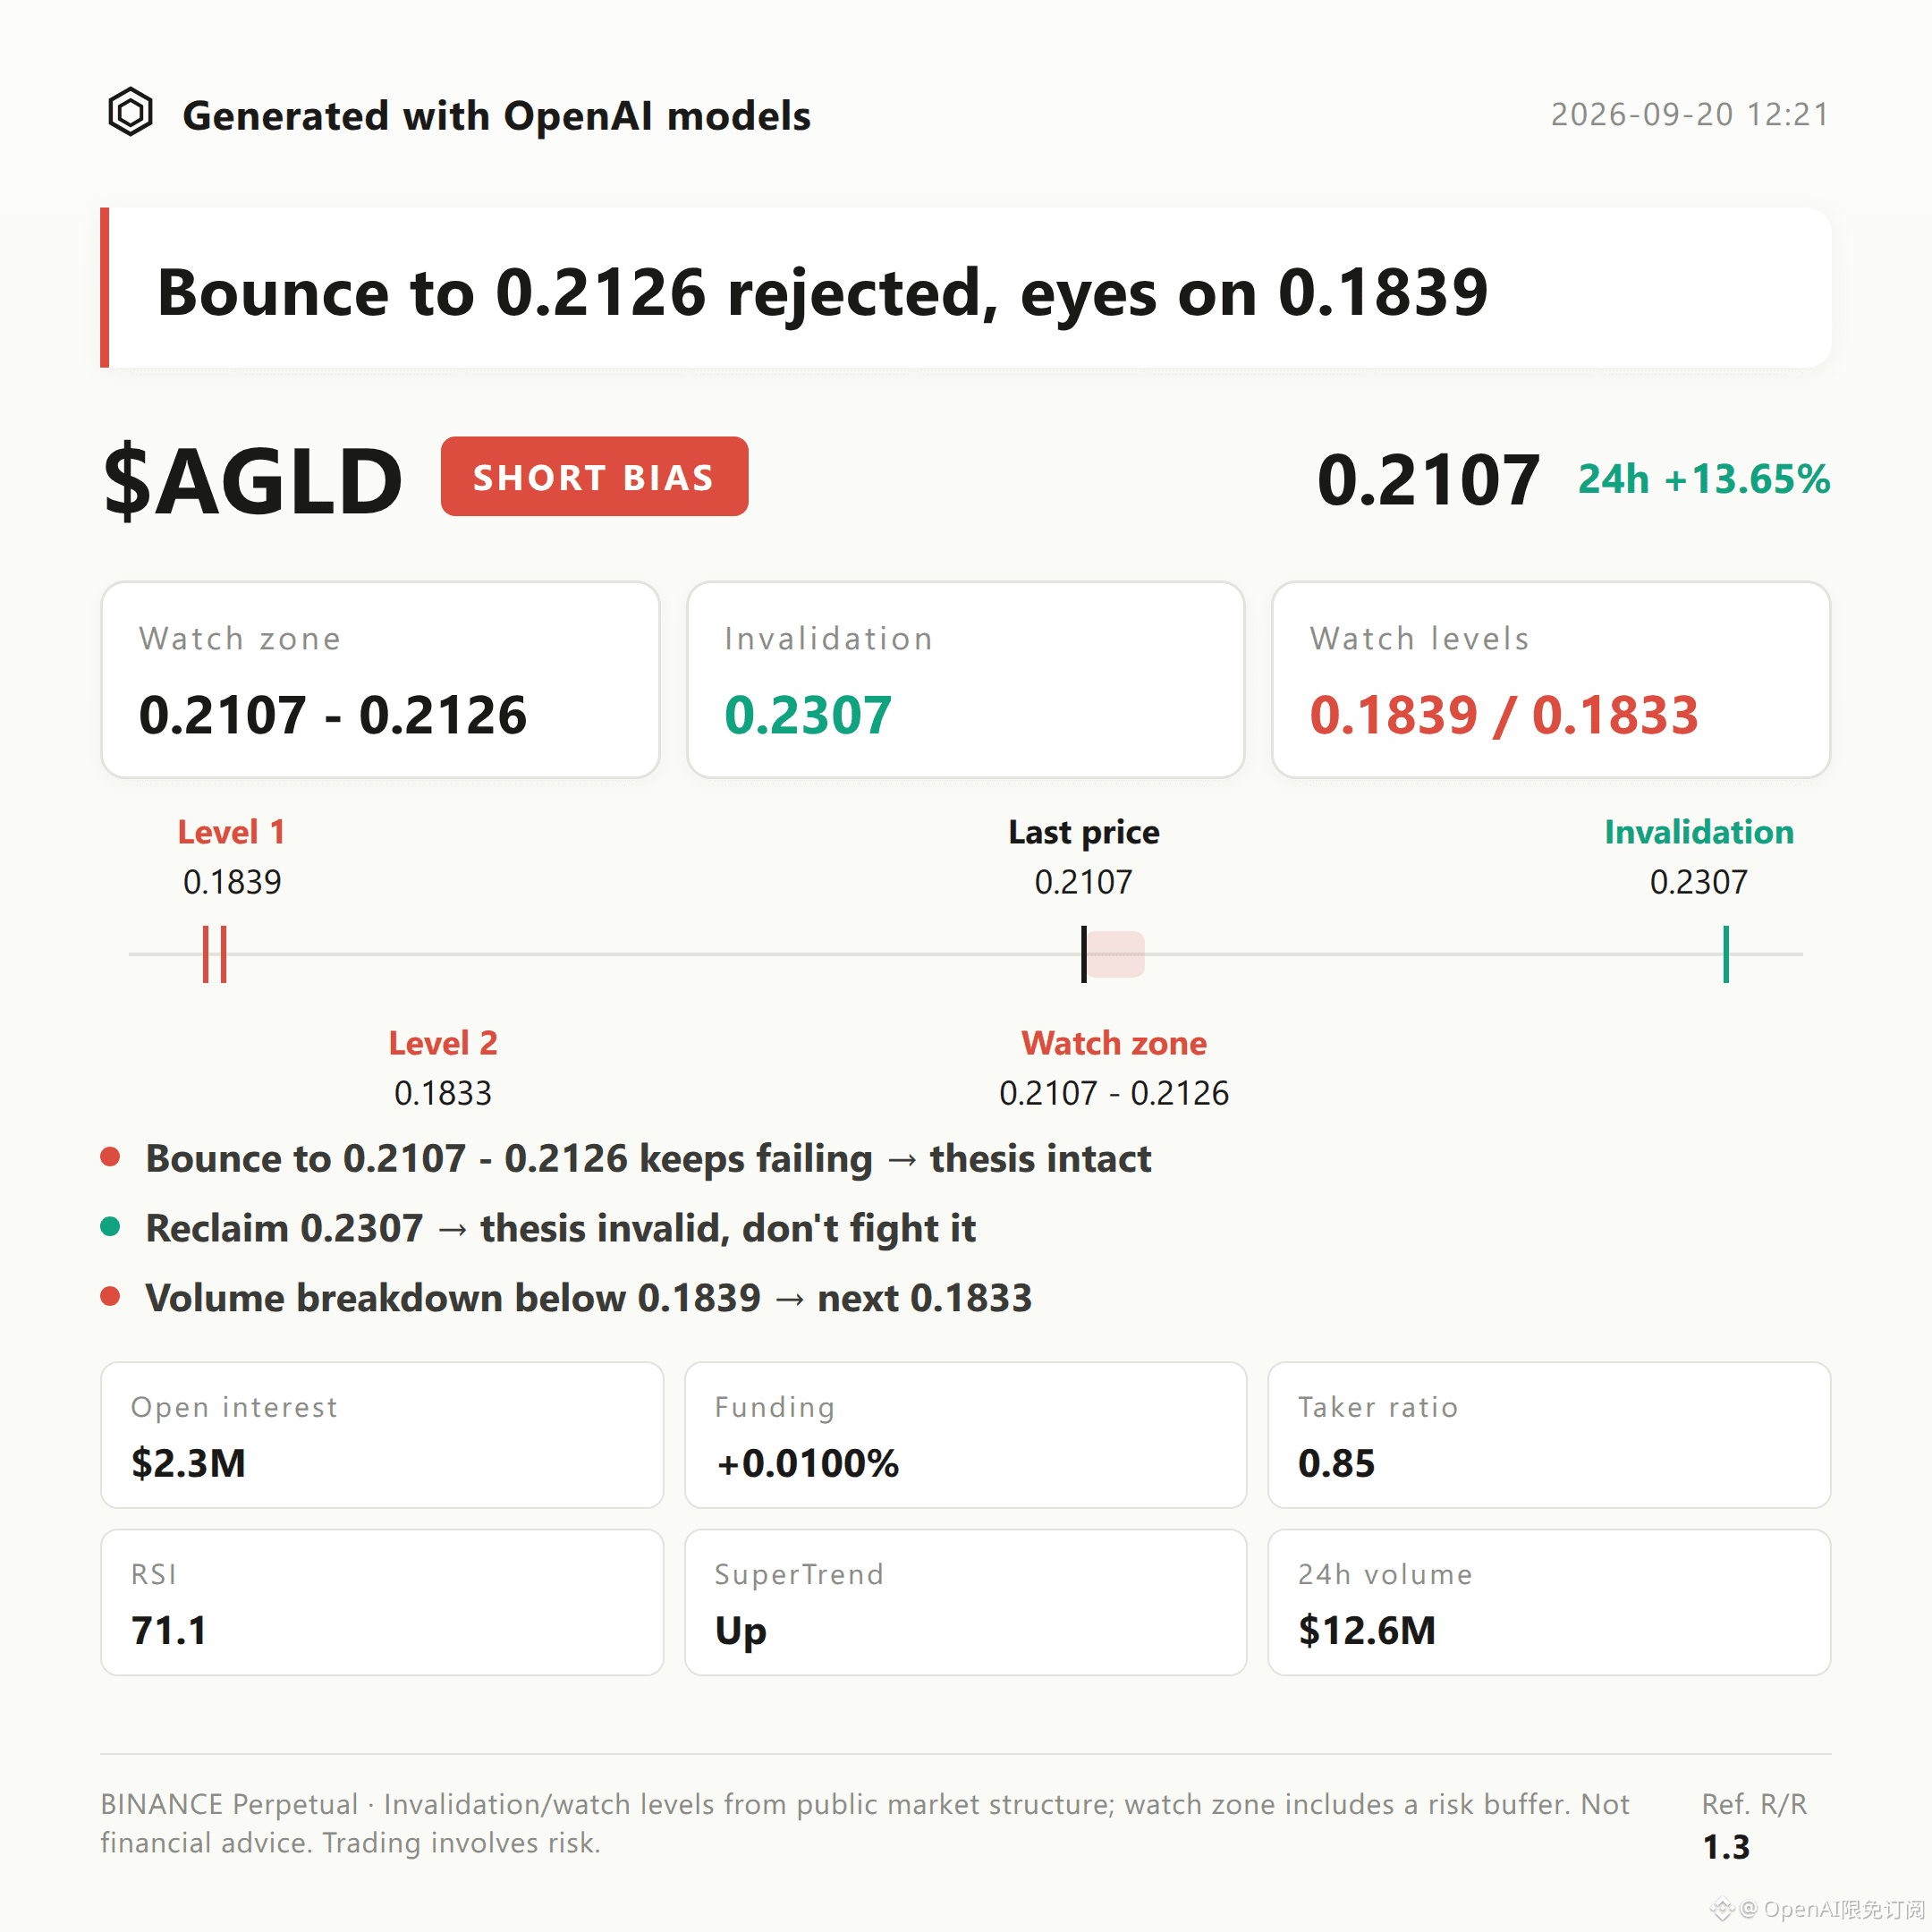
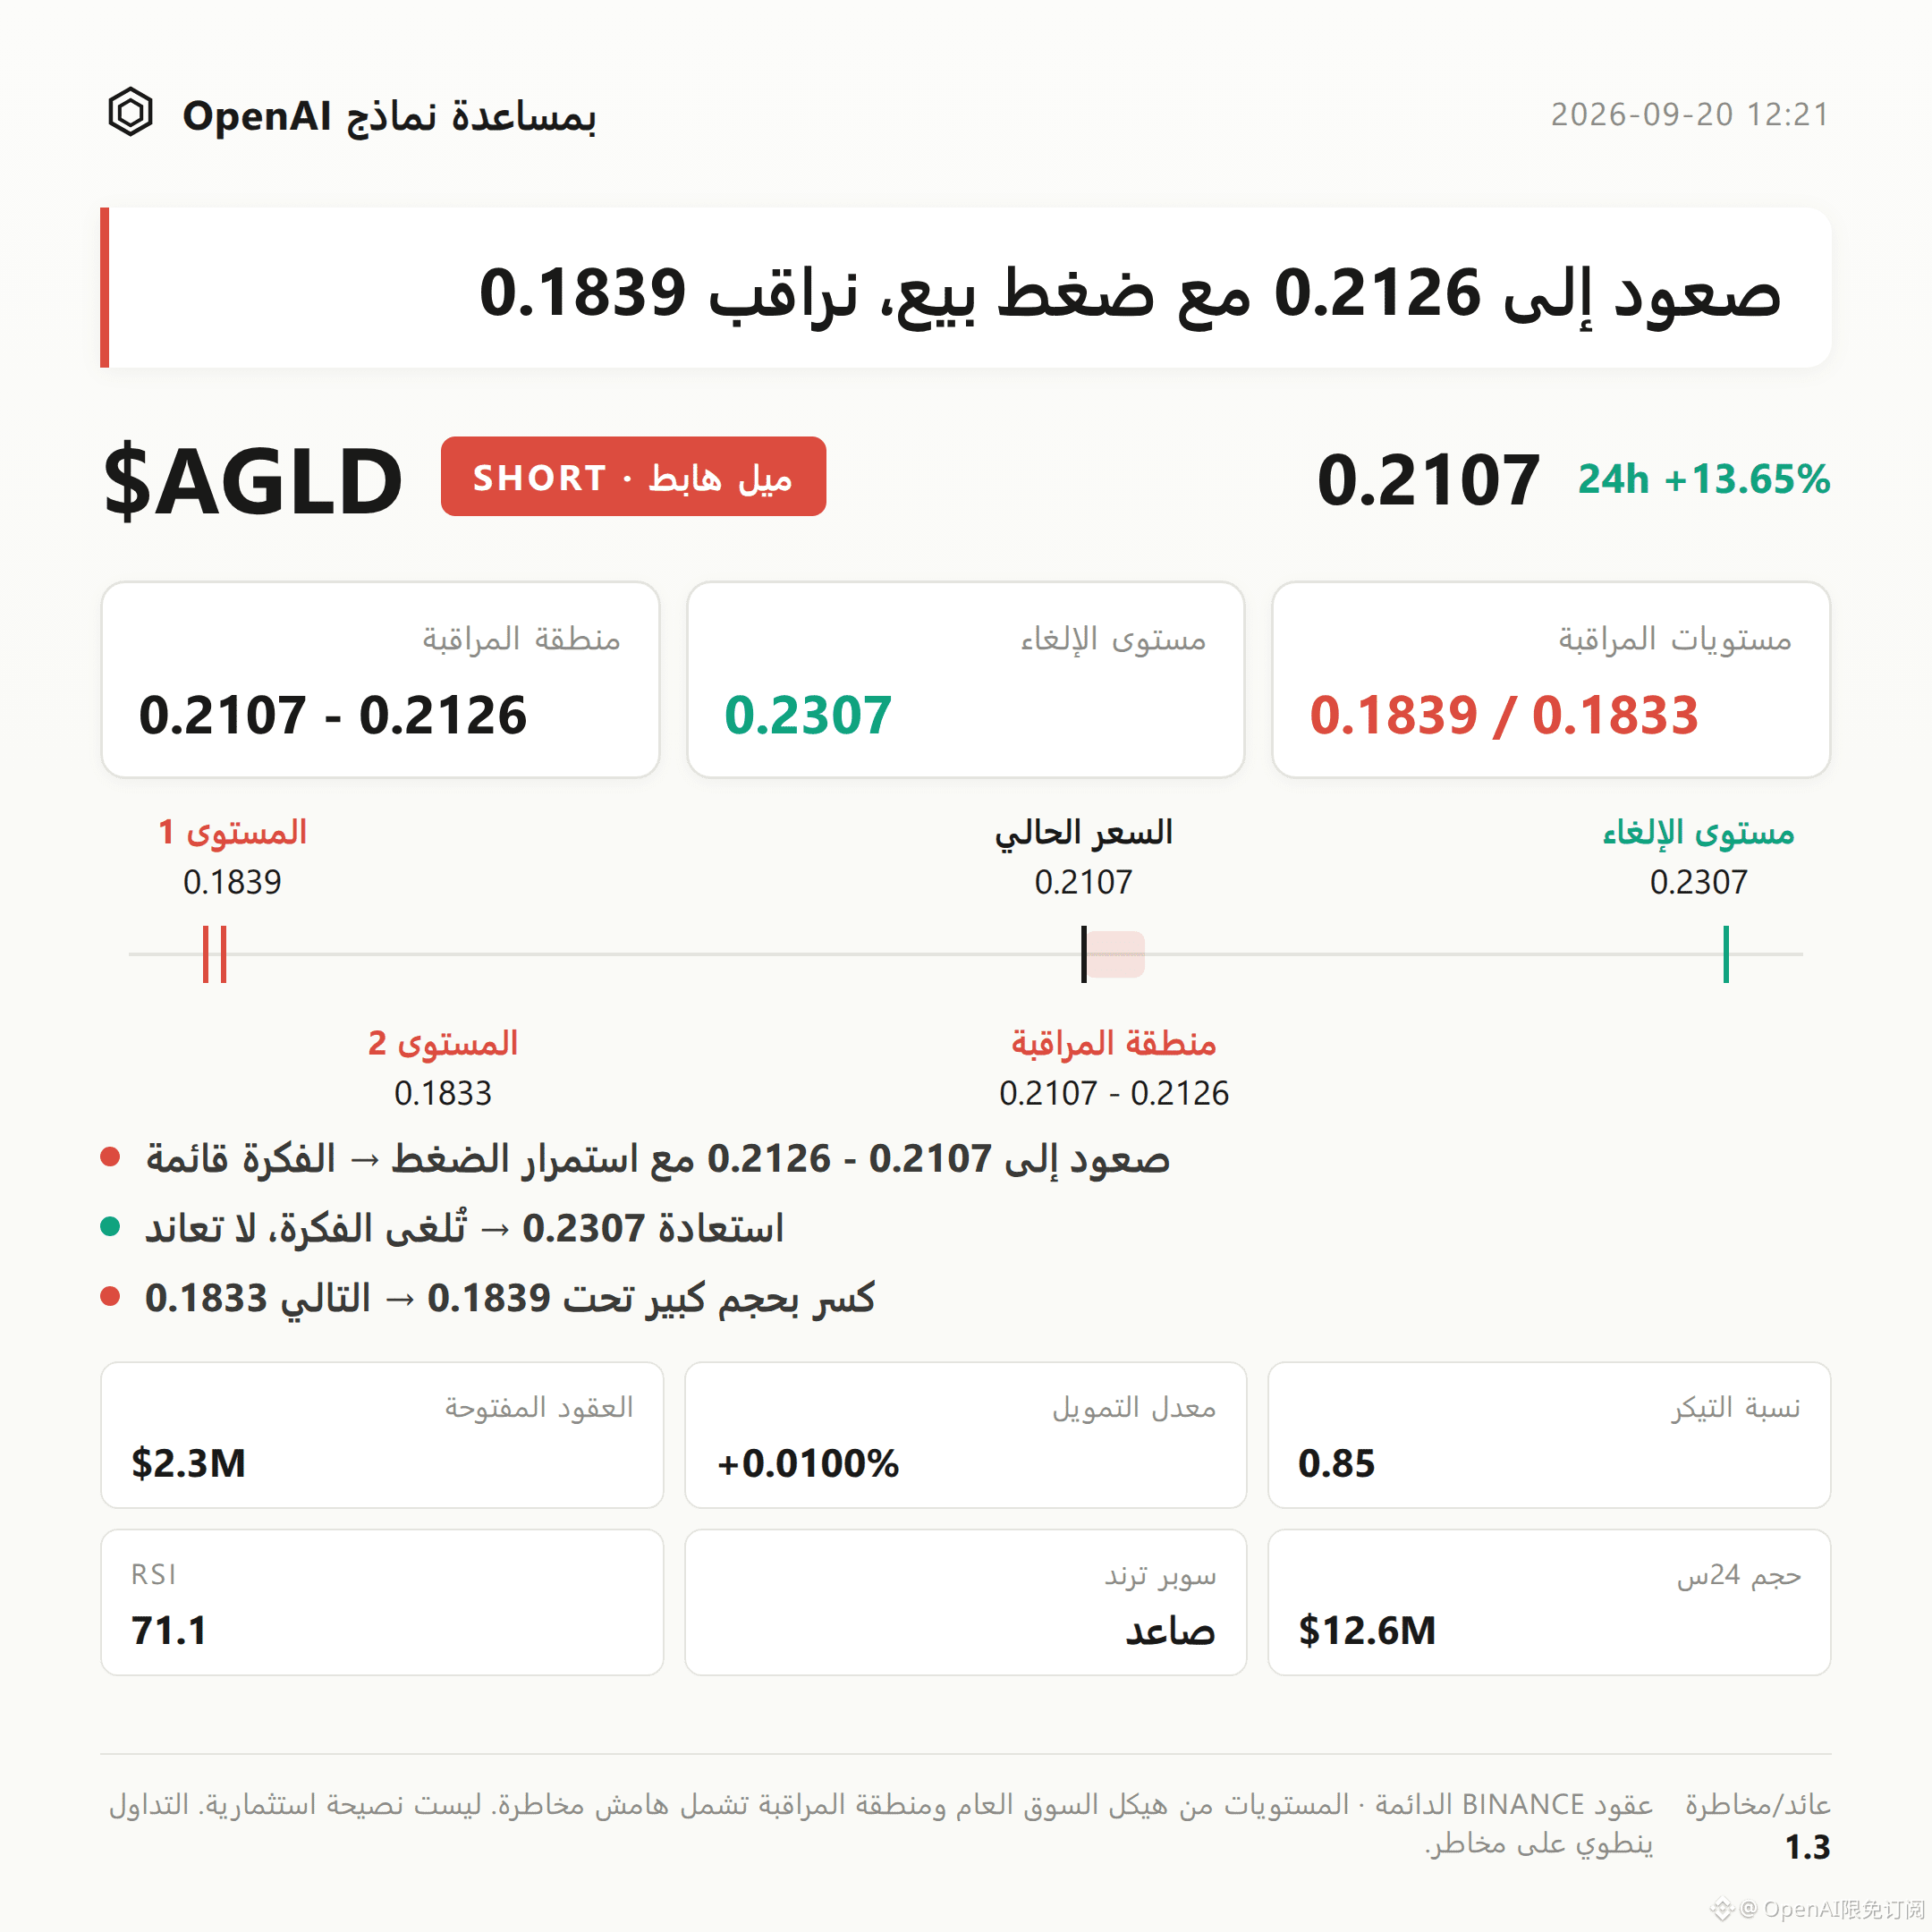
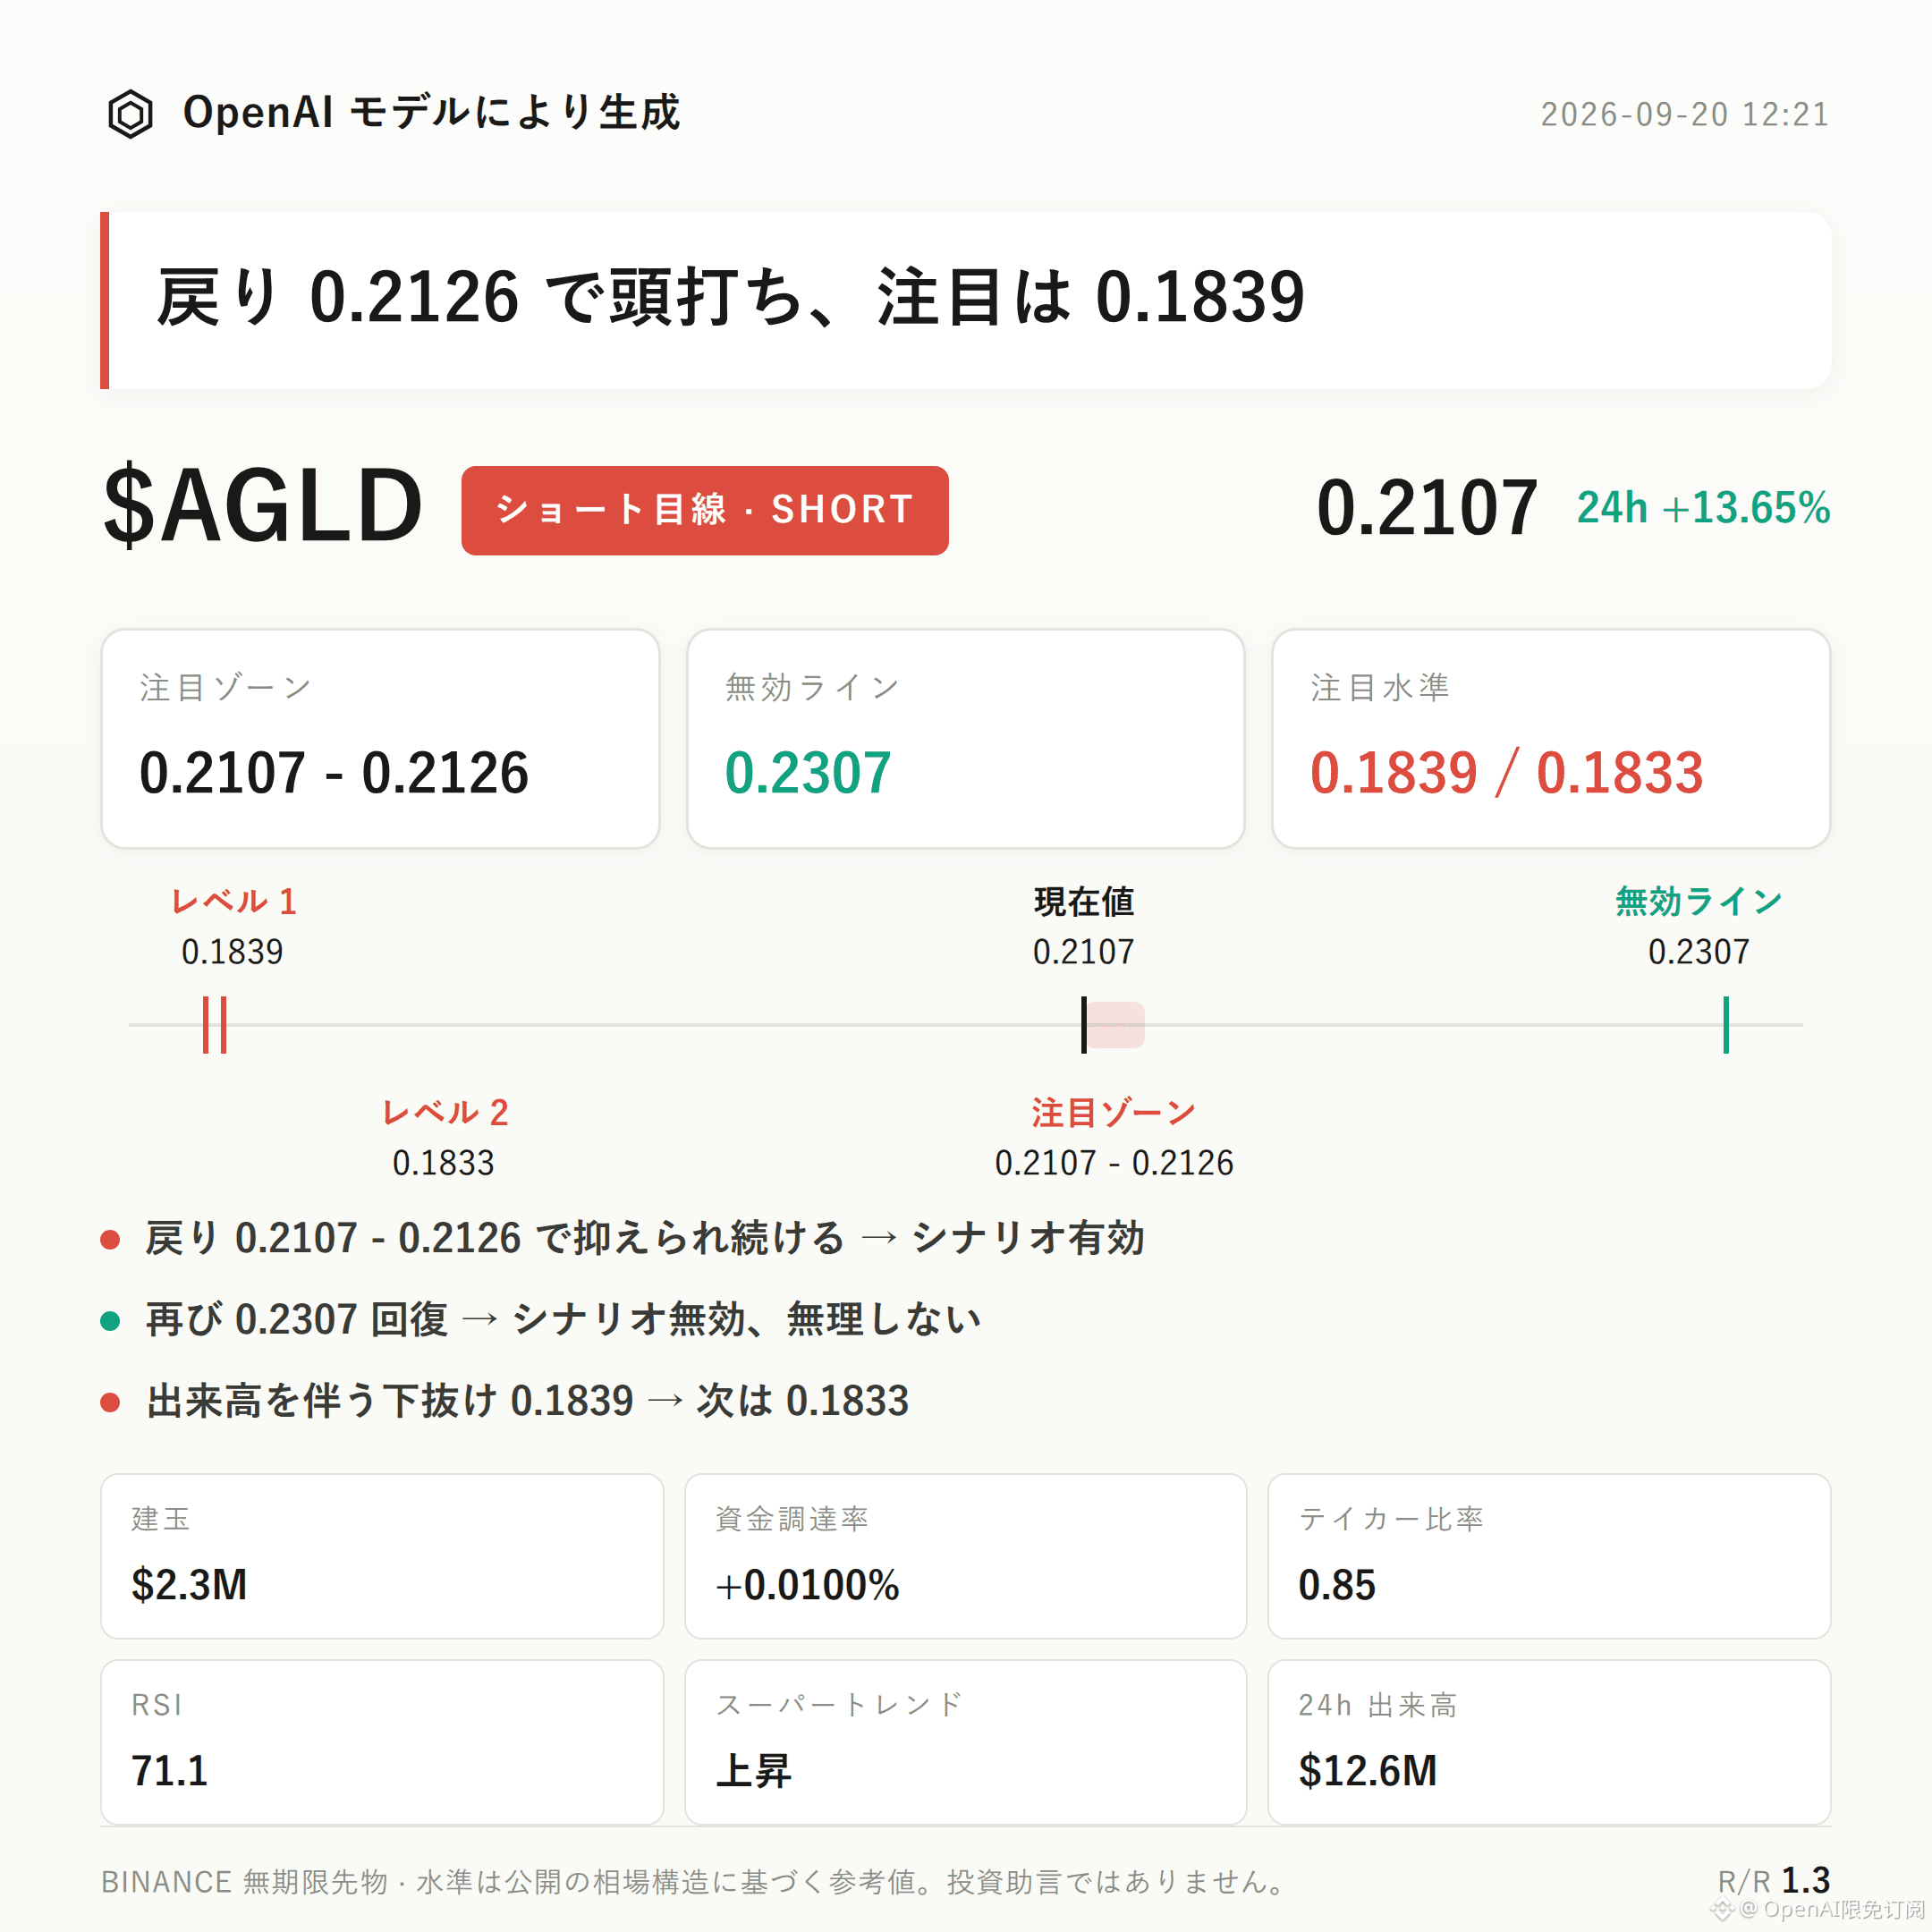
$AGLD bearish-leaning setup | Watch zone 0.2107 - 0.2126 | Invalidation reference 0.2307 | Observation levels 0.1839 / 0.1833
$AGLD is currently moving within a bearish-leaning structure.
The key thesis is that active sell orders remain dominant (active buy/sell ratio 0.85), RSI has reached 71.1 which is in an overheated zone, and while the price has risen 13.65% in a single day, open interest has surged by 47.5%, indicating that chasing buyers are crowded at higher levels.
For validation, focus on whether the pullback can be suppressed within the resistance area.
From a technical structure perspective: the recent high is 0.2307, the recent low is 0.1833. The current price at 0.2107 is close to the upper Bollinger Band at 0.2126, with the middle band at 0.1982 and the lower band at 0.1839.
The Supertrend indicator is still marked as trending upward, and MACD shows long momentum has not been broken. However, RSI at 71.1 is in an uncommon overheated range; when price runs along the upper band, the probability of momentum indicators becoming dull increases.
In derivatives data: 24-hour trading volume is about $12.56M, open interest is about $2.28M, and it has spiked by 47.5% in 24 hours. Funding rate is +0.0100%. The long accounts share is 68%. An active buy/sell ratio of 0.85 suggests active sell orders are slightly dominant.
Open interest is building rapidly alongside a sharp price increase. Combined with the clearly elevated long accounts share, this suggests the market is concentrated with chasing buyers. Once the pullback meets resistance or profit-taking occurs, a same-direction squeeze is likely.
On reference levels: for the bearish side, start by watching 0.2107 - 0.2126. It’s more suitable to wait for confirmation after the pullback comes under pressure.
If the pullback stalls and falls back within this zone, the bearish structure gains support. If price reclaims 0.2307, it means the current retracement structure is broken and the bearish thesis is invalid—do not continue using it.
For the downside observation extension, watch 0.1839. If there is a volume-backed breakdown below it, then look for support performance around 0.1833.
Need to state clearly: no significant opposite-direction signals have been observed so far, but contract leverage itself is a risk source that cannot be ignored.
The reference risk-reward ratio is around 1.3, so there isn’t much room. If the judgment is wrong, the drawdown could arrive quickly.
With contract leverage, position discipline is more important than directional judgment.
For reference only and does not constitute investment advice. Contracts involve leverage—investing has risk.
This article was generated with assistance from an OpenAI large model.
$AGLD #Contract analysis
$AGLD bearish-leaning setup | Watch zone 0.2107 - 0.2126 | Invalidation reference 0.2307 | Observation levels 0.1839 / 0.1833
$AGLD is currently moving within a bearish-leaning structure.
The key thesis is that active sell orders remain dominant (active buy/sell ratio 0.85), RSI has reached 71.1 which is in an overheated zone, and while the price has risen 13.65% in a single day, open interest has surged by 47.5%, indicating that chasing buyers are crowded at higher levels.
For validation, focus on whether the pullback can be suppressed within the resistance area.
From a technical structure perspective: the recent high is 0.2307, the recent low is 0.1833. The current price at 0.2107 is close to the upper Bollinger Band at 0.2126, with the middle band at 0.1982 and the lower band at 0.1839.
The Supertrend indicator is still marked as trending upward, and MACD shows long momentum has not been broken. However, RSI at 71.1 is in an uncommon overheated range; when price runs along the upper band, the probability of momentum indicators becoming dull increases.
In derivatives data: 24-hour trading volume is about $12.56M, open interest is about $2.28M, and it has spiked by 47.5% in 24 hours. Funding rate is +0.0100%. The long accounts share is 68%. An active buy/sell ratio of 0.85 suggests active sell orders are slightly dominant.
Open interest is building rapidly alongside a sharp price increase. Combined with the clearly elevated long accounts share, this suggests the market is concentrated with chasing buyers. Once the pullback meets resistance or profit-taking occurs, a same-direction squeeze is likely.
On reference levels: for the bearish side, start by watching 0.2107 - 0.2126. It’s more suitable to wait for confirmation after the pullback comes under pressure.
If the pullback stalls and falls back within this zone, the bearish structure gains support. If price reclaims 0.2307, it means the current retracement structure is broken and the bearish thesis is invalid—do not continue using it.
For the downside observation extension, watch 0.1839. If there is a volume-backed breakdown below it, then look for support performance around 0.1833.
Need to state clearly: no significant opposite-direction signals have been observed so far, but contract leverage itself is a risk source that cannot be ignored.
The reference risk-reward ratio is around 1.3, so there isn’t much room. If the judgment is wrong, the drawdown could arrive quickly.
With contract leverage, position discipline is more important than directional judgment.
For reference only and does not constitute investment advice. Contracts involve leverage—investing has risk.
This article was generated with assistance from an OpenAI large model.
$AGLD #Contract analysis