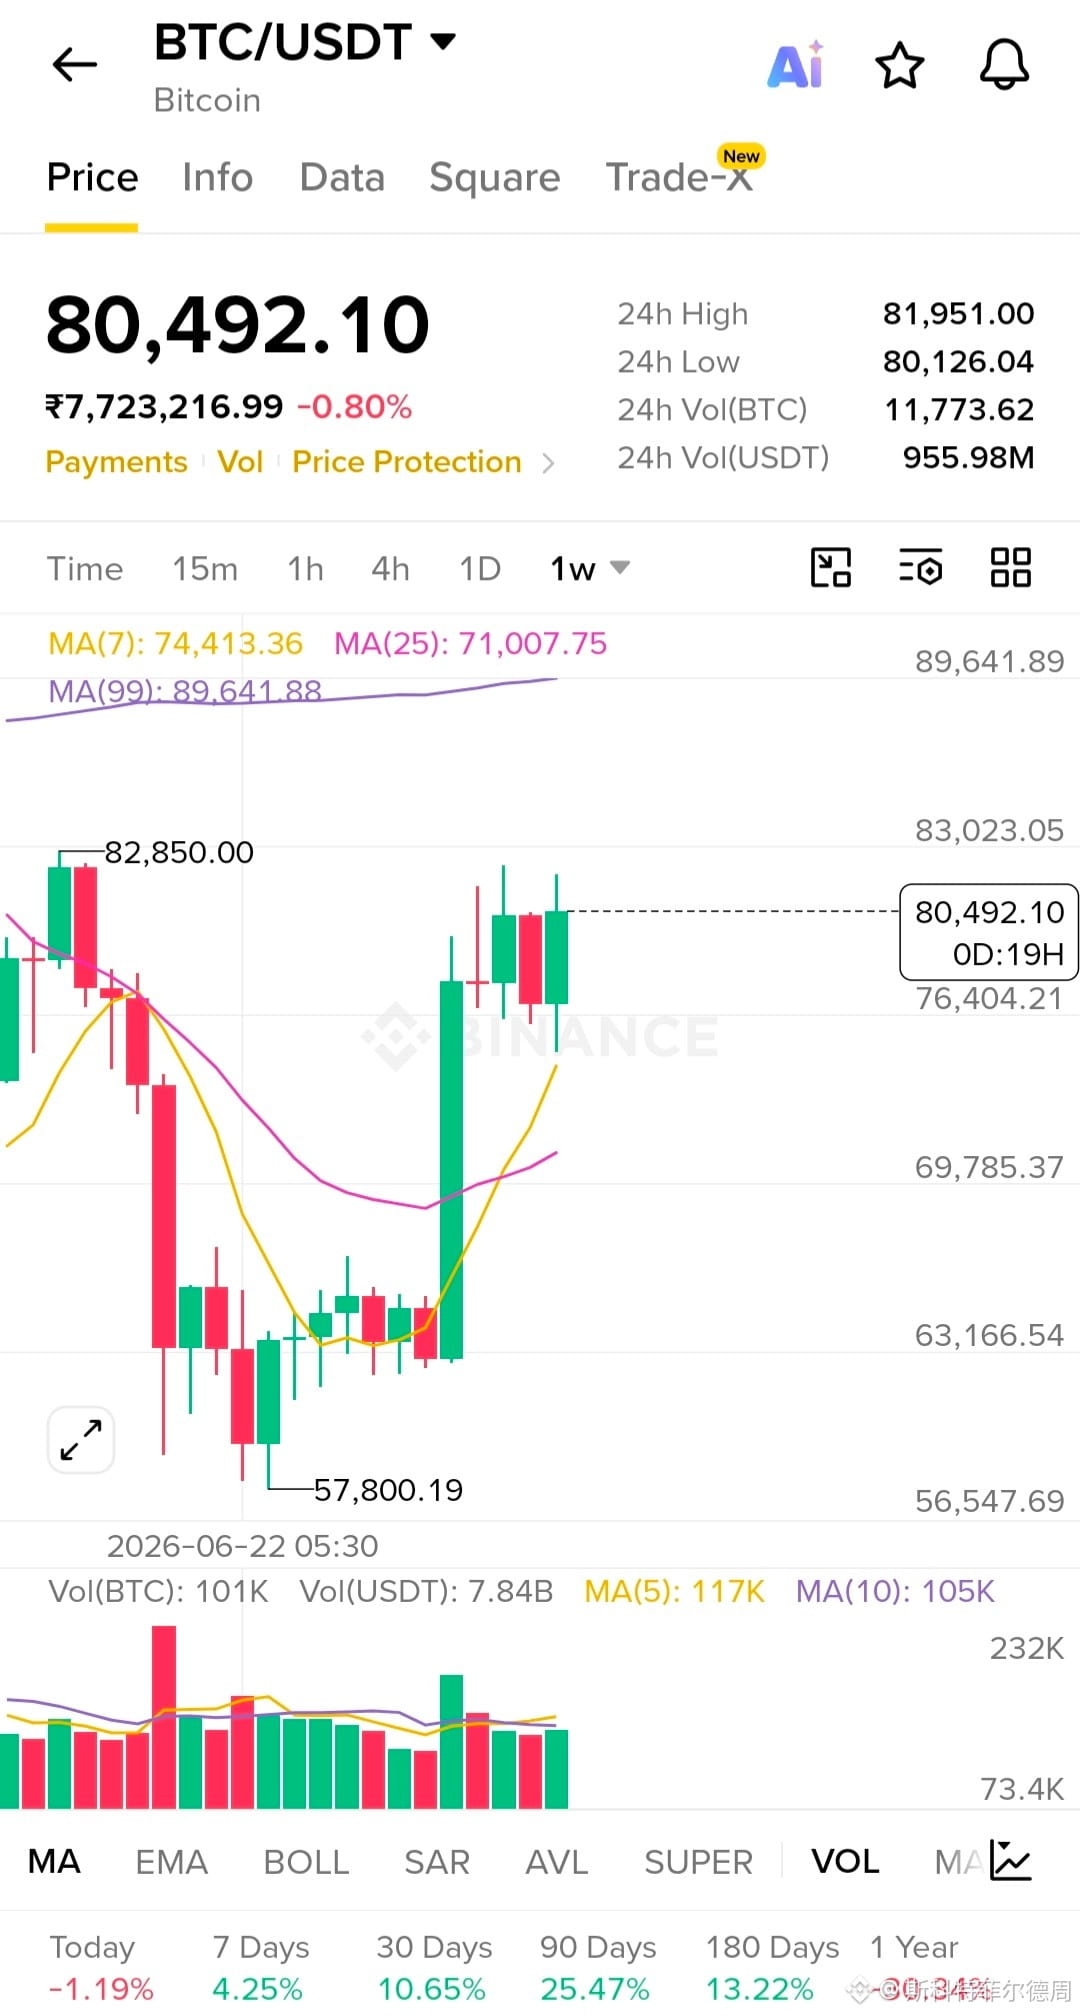
📊 1W chart --
Price: $80,492
MA(7): $74,413 → price is comfortably above it.
MA(25): $71,008 → bullish medium-term positioning.
MA(99): $89,642 → major overhead resistance.
Recent low: $57,800
Major visible resistance: $82,850, then $89.6K.
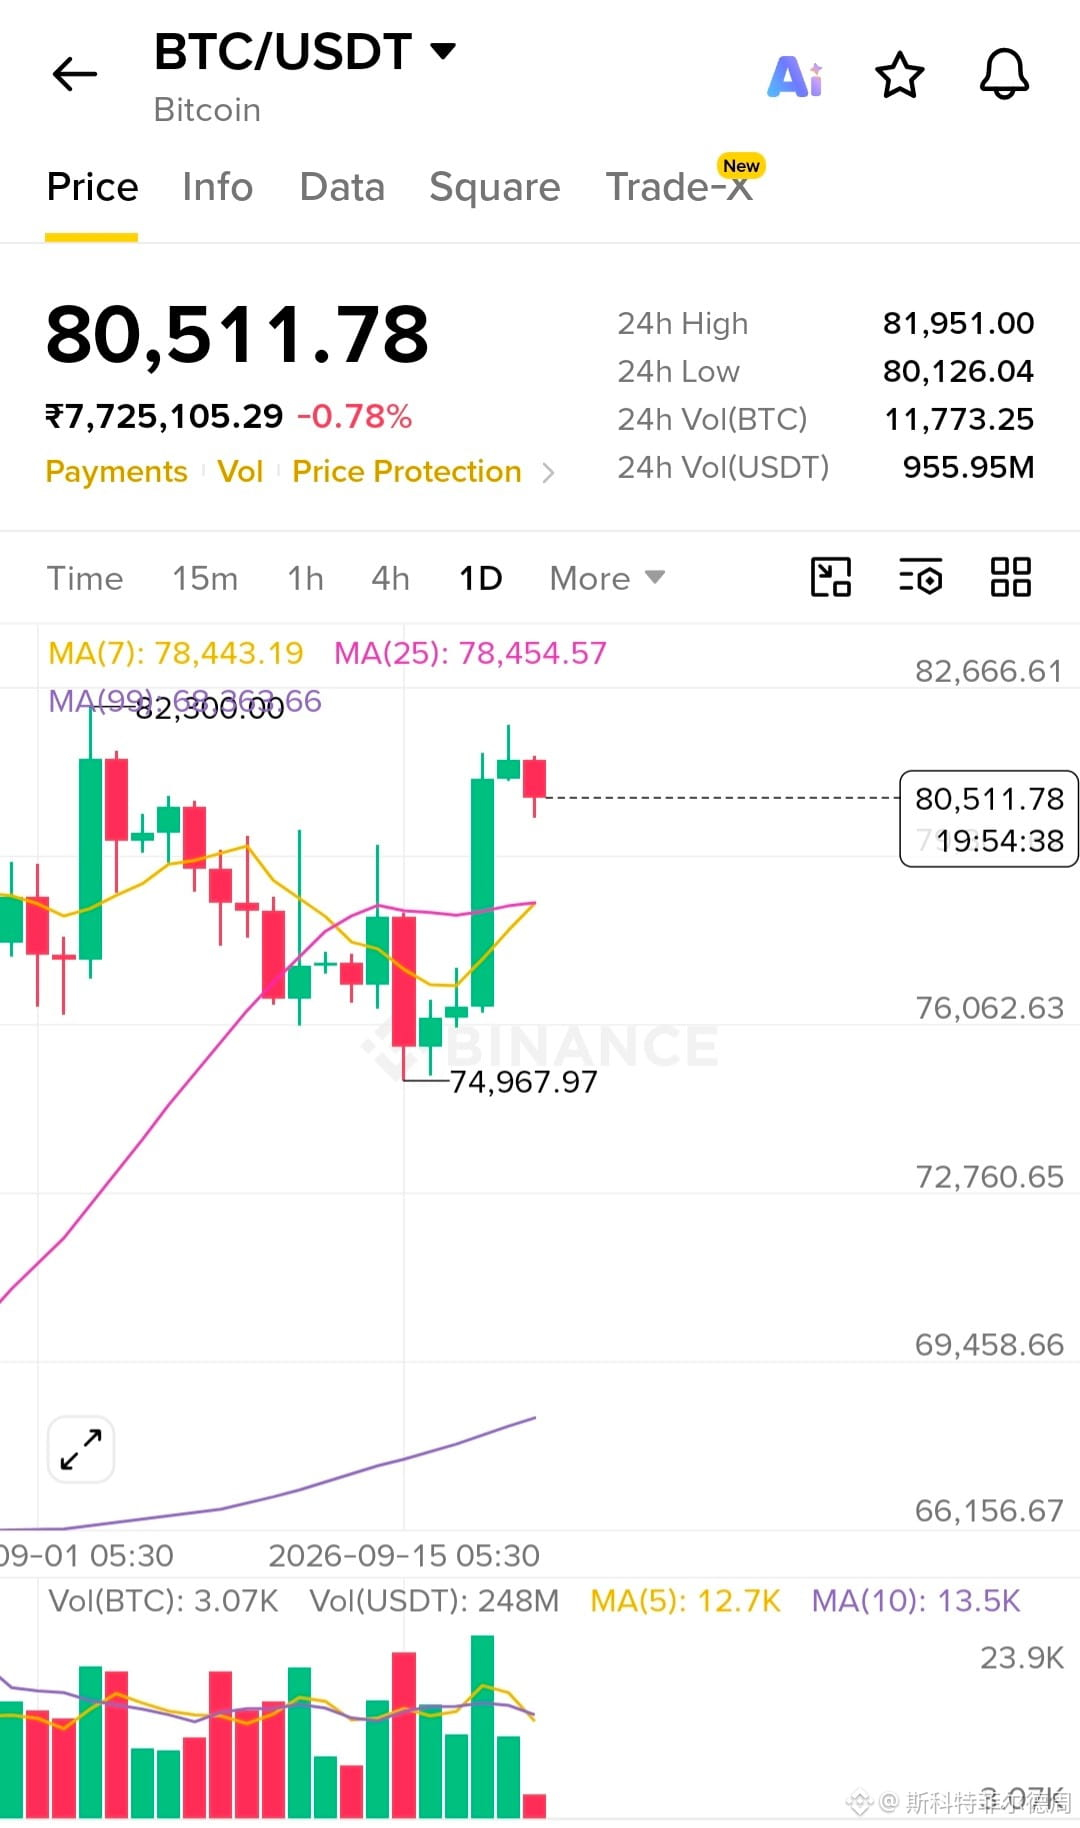
📈 1D chart — immediate picture
Price: $80,512
MA(7): $78,443
MA(25): $78,455
Price is above both → short-term structure remains bullish.
Recent high: approximately $82.85K
Current candles show hesitation after the strong upward move.
Volume expanded during the breakout, but the latest candle's volume is relatively low → momentum needs confirmation.
🔑 Levels
$82,850–$83,000
Major breakout resistance
$81,950
24h high / first confirmation area
$80,000–$80,500
Current decision zone
$78,400–$78,500
Daily MA7/MA25 support
$76,000
Important deeper support
$71,000–$72,000
Weekly MA25 / major support
🚦Next-move scenarios
Bullish confirmation:
If BTC gets a daily close above $82.85K, preferably with increasing volume, that would confirm a breakout from the current resistance zone. The next major area visible on your weekly chart is around $89K–$90K.
Rejection scenario:
If BTC fails around $82K–$83K and falls below $78.4K, the current short-term bullish structure weakens. The next areas I'd watch are approximately $76K, followed by $71K–$72K.
The cleaner setups are either:
Breakout + confirmation above $82.85K, or
Pullback toward $78.4K–$78.5K followed by a bullish reaction.
#BTC $BTC #dyor
@Eggtartcake_
Price: $80,492
MA(7): $74,413 → price is comfortably above it.
MA(25): $71,008 → bullish medium-term positioning.
MA(99): $89,642 → major overhead resistance.
Recent low: $57,800
Major visible resistance: $82,850, then $89.6K.
📈 1D chart — immediate picture
Price: $80,512
MA(7): $78,443
MA(25): $78,455
Price is above both → short-term structure remains bullish.
Recent high: approximately $82.85K
Current candles show hesitation after the strong upward move.
Volume expanded during the breakout, but the latest candle's volume is relatively low → momentum needs confirmation.
🔑 Levels
$82,850–$83,000
Major breakout resistance
$81,950
24h high / first confirmation area
$80,000–$80,500
Current decision zone
$78,400–$78,500
Daily MA7/MA25 support
$76,000
Important deeper support
$71,000–$72,000
Weekly MA25 / major support
🚦Next-move scenarios
Bullish confirmation:
If BTC gets a daily close above $82.85K, preferably with increasing volume, that would confirm a breakout from the current resistance zone. The next major area visible on your weekly chart is around $89K–$90K.
Rejection scenario:
If BTC fails around $82K–$83K and falls below $78.4K, the current short-term bullish structure weakens. The next areas I'd watch are approximately $76K, followed by $71K–$72K.
The cleaner setups are either:
Breakout + confirmation above $82.85K, or
Pullback toward $78.4K–$78.5K followed by a bullish reaction.
#BTC $BTC #dyor
@Eggtartcake_