$ZK This time it’s not that it rose first and then you came back to find excuses—it’s that the record existed first, and the result followed.
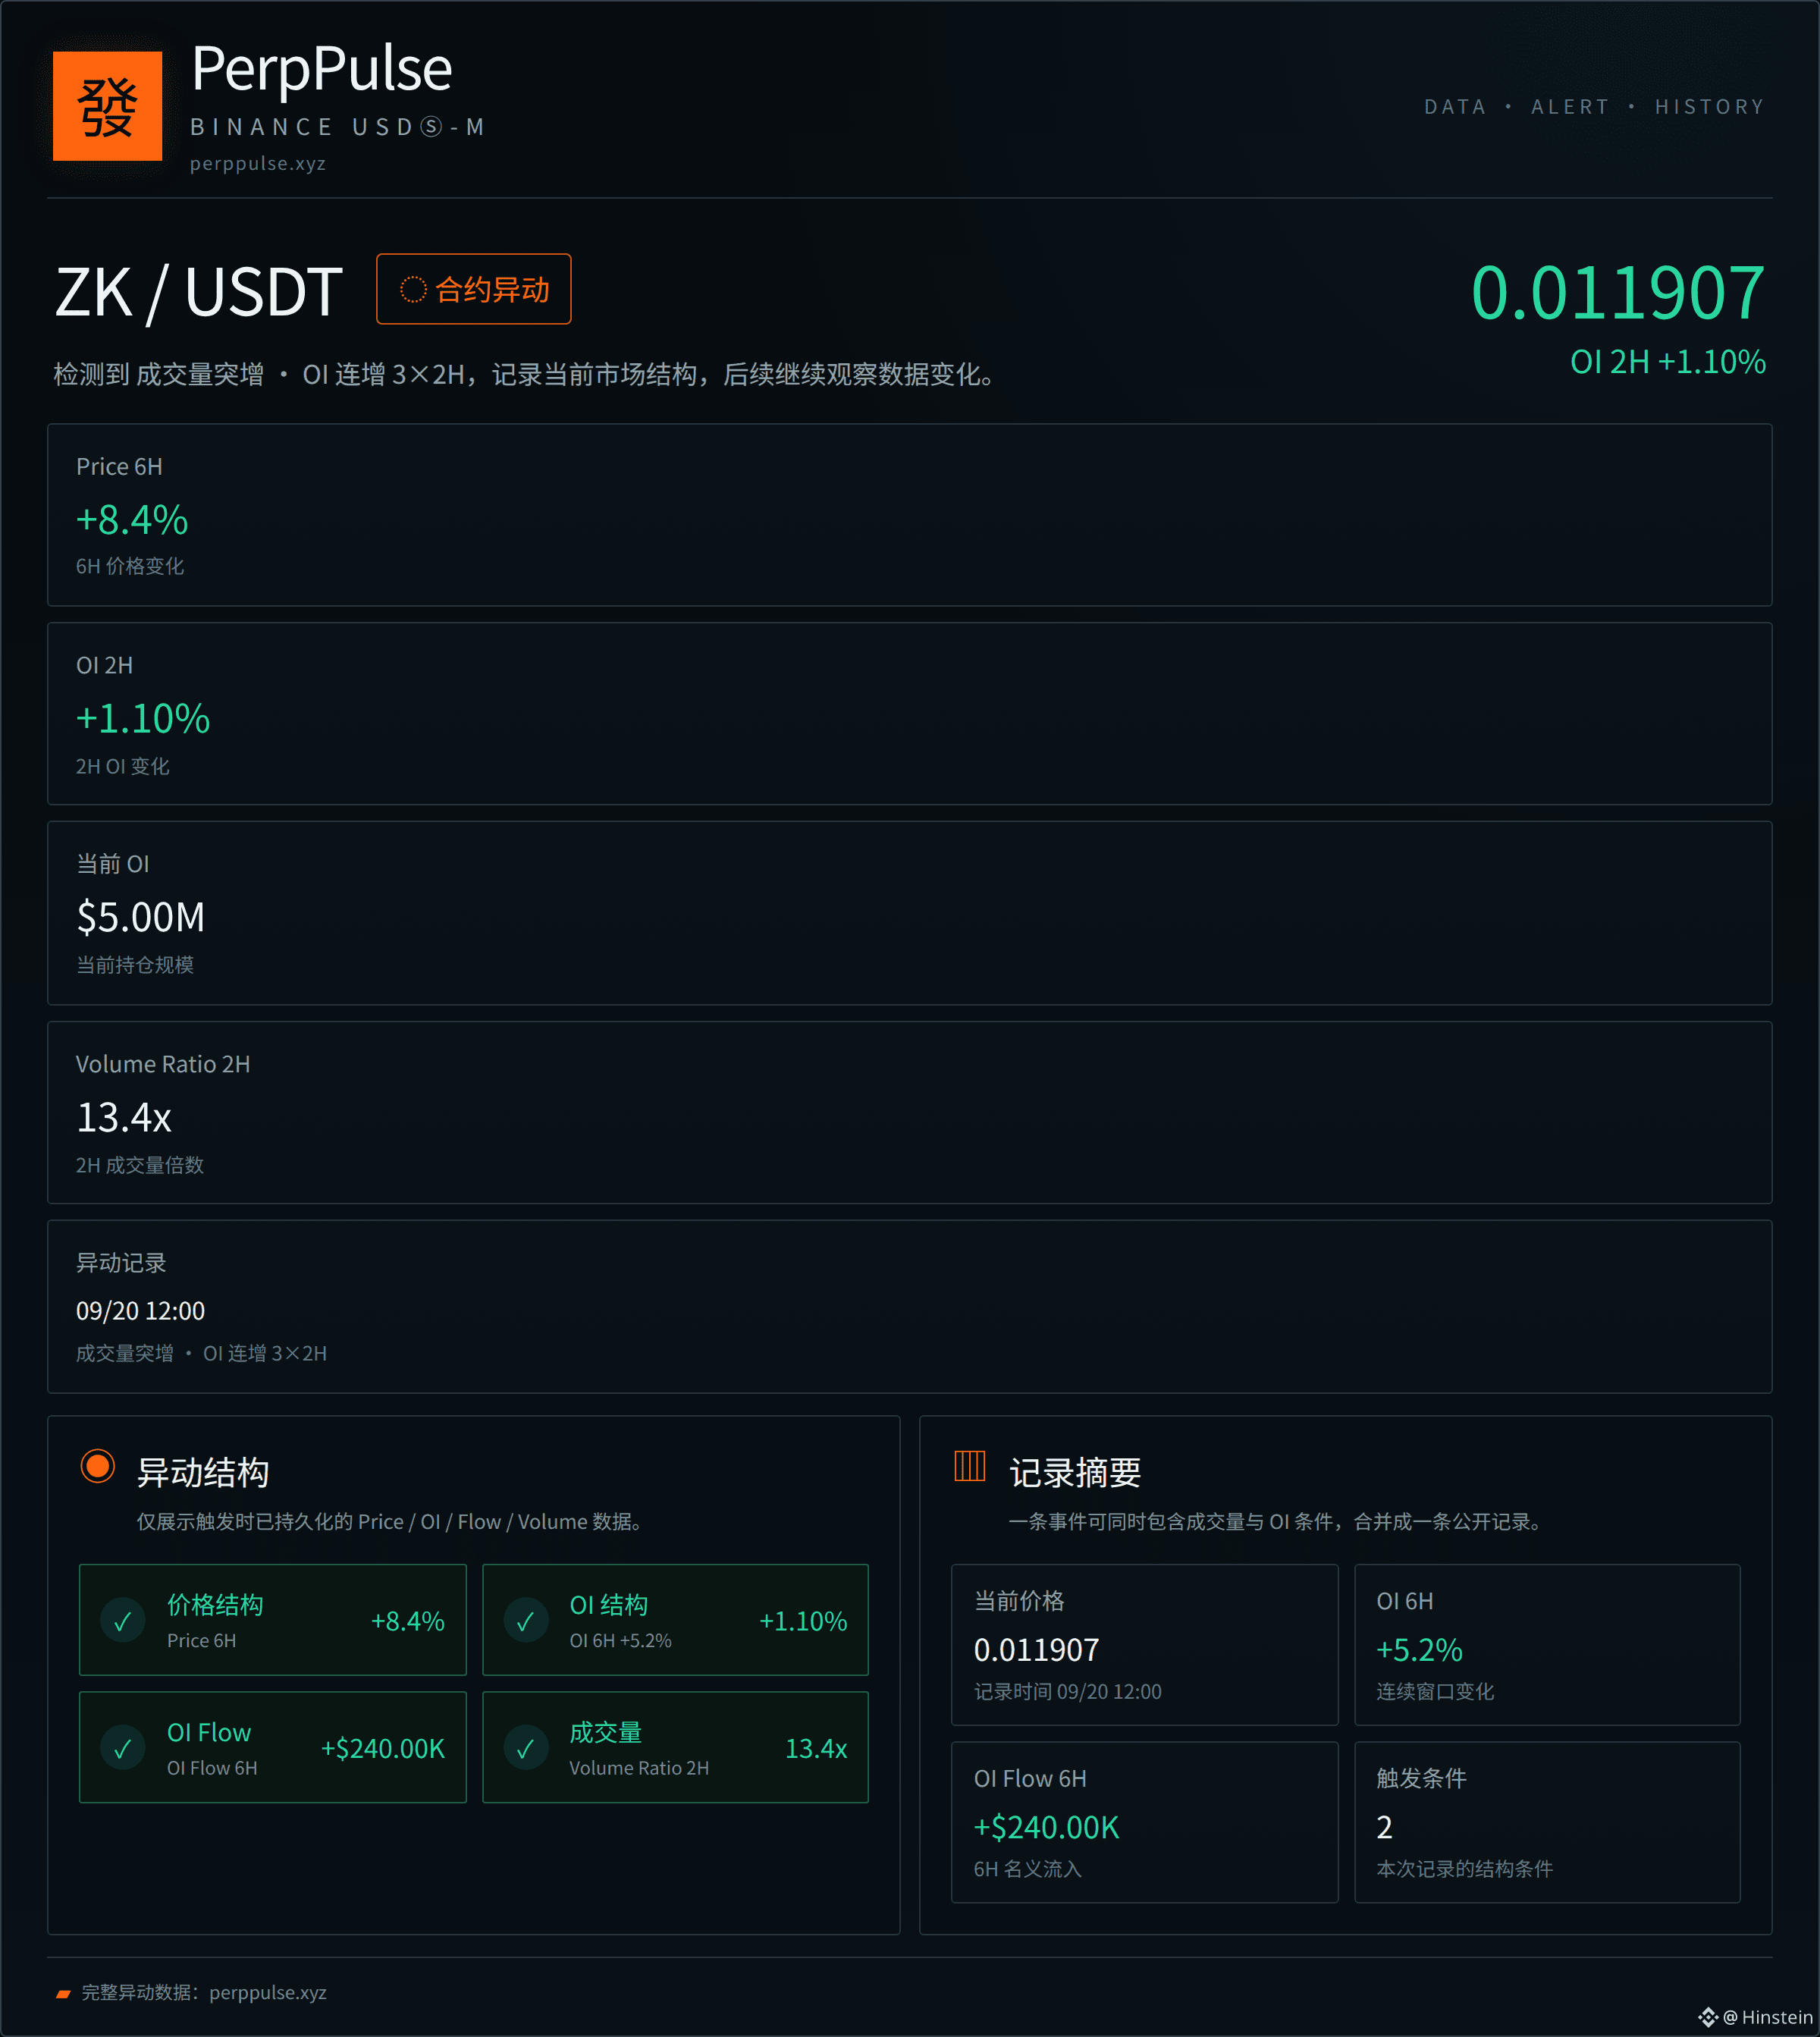
At 2026-09-20 12:00 +0800, ZKUSDT was recorded as meeting two structural conditions at the same time: a sharp surge in trading volume, and an OI increase continuing for 3 consecutive 2H windows. The alert price level at the time was 0.011907.
What’s worth noting is that this isn’t an isolated spike from a single indicator. The 2H volume ratio reached 13.4, indicating trading activity clearly deviated from the norm during that period. Meanwhile, OI increased by 1.1% in the 2H dimension and by 5.2% in the 6H dimension—the position size expanded along with it, rather than just making a quick push in price. The 6H price change was recorded at +8.4%.
Putting these numbers together, what the observation window reflects is a “synchronized change in volume and positions”: trading activity expands, positions accumulate continuously, and price moves upward within the same range—captured at the same time point. As for the 2H OI Flow continuous condition, this time it was not recorded as satisfied, so there’s no need to force a narrative like “funds continuously flowing in.”
I’d rather treat this kind of record as a coordinate: it doesn’t answer what will happen next—it only answers that at 12:00, the market structure for ZK indeed showed a combination that deviated from normal. Record it first, then see whether it carries on afterward.
$ZK #ZK #BinanceSquare
📌 Verifiable record
Type: Trading volume surge · OI increases for 3×2H
Record time: 2026-09-20 12:00 +0800
Record level: 0.011907
Price 6H: +8.4%
OI 2H: +1.1%
OI 6H: +5.2%
OI Flow 6H: 239838.29
Vol 2H: 13.4x
Full anomaly data: perppulse.xyz
At 2026-09-20 12:00 +0800, ZKUSDT was recorded as meeting two structural conditions at the same time: a sharp surge in trading volume, and an OI increase continuing for 3 consecutive 2H windows. The alert price level at the time was 0.011907.
What’s worth noting is that this isn’t an isolated spike from a single indicator. The 2H volume ratio reached 13.4, indicating trading activity clearly deviated from the norm during that period. Meanwhile, OI increased by 1.1% in the 2H dimension and by 5.2% in the 6H dimension—the position size expanded along with it, rather than just making a quick push in price. The 6H price change was recorded at +8.4%.
Putting these numbers together, what the observation window reflects is a “synchronized change in volume and positions”: trading activity expands, positions accumulate continuously, and price moves upward within the same range—captured at the same time point. As for the 2H OI Flow continuous condition, this time it was not recorded as satisfied, so there’s no need to force a narrative like “funds continuously flowing in.”
I’d rather treat this kind of record as a coordinate: it doesn’t answer what will happen next—it only answers that at 12:00, the market structure for ZK indeed showed a combination that deviated from normal. Record it first, then see whether it carries on afterward.
$ZK #ZK #BinanceSquare
📌 Verifiable record
Type: Trading volume surge · OI increases for 3×2H
Record time: 2026-09-20 12:00 +0800
Record level: 0.011907
Price 6H: +8.4%
OI 2H: +1.1%
OI 6H: +5.2%
OI Flow 6H: 239838.29
Vol 2H: 13.4x
Full anomaly data: perppulse.xyz