

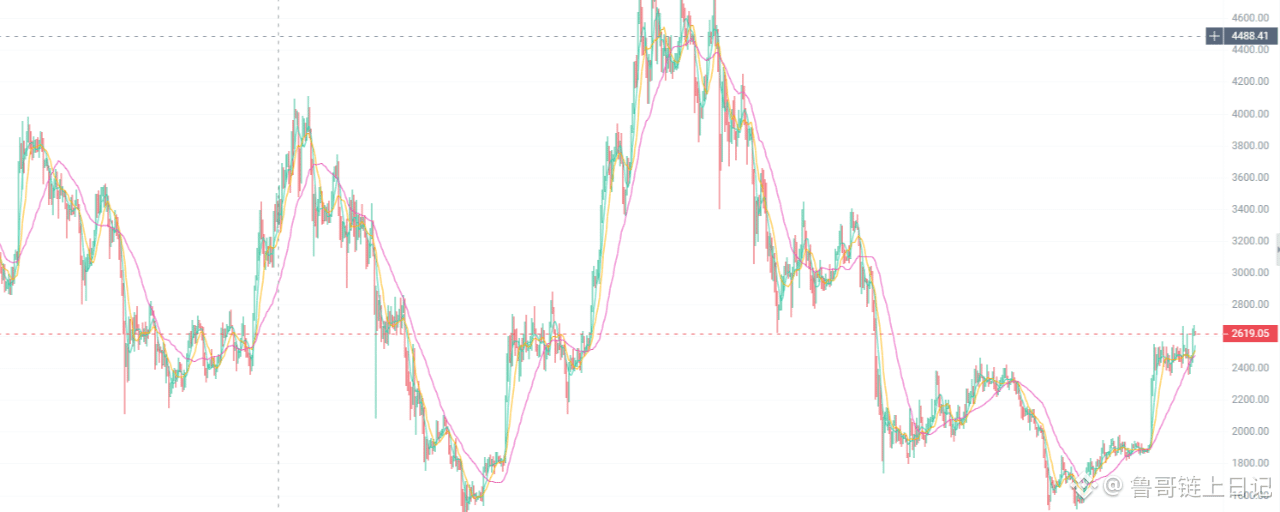

Fellow coin friends, I’m your old friend. On September 20, ETH surged higher on the short-term to around 2619.66, and then the long side’s momentum showed a dramatic exhaustion signal. Judging from the combination of multi-timeframe K-lines and the volume-price structure, the market is currently in a typical “top divergence + high-level consolidation without follow-through” state. Profit-taking and breakout-sell pressure from trapped traders are everywhere, and the signal that the short-side main force is gathering power to launch a downward counterattack is now very clear!
🔍 In-depth analysis of the technical indicators across three major timeframes (K-lines)
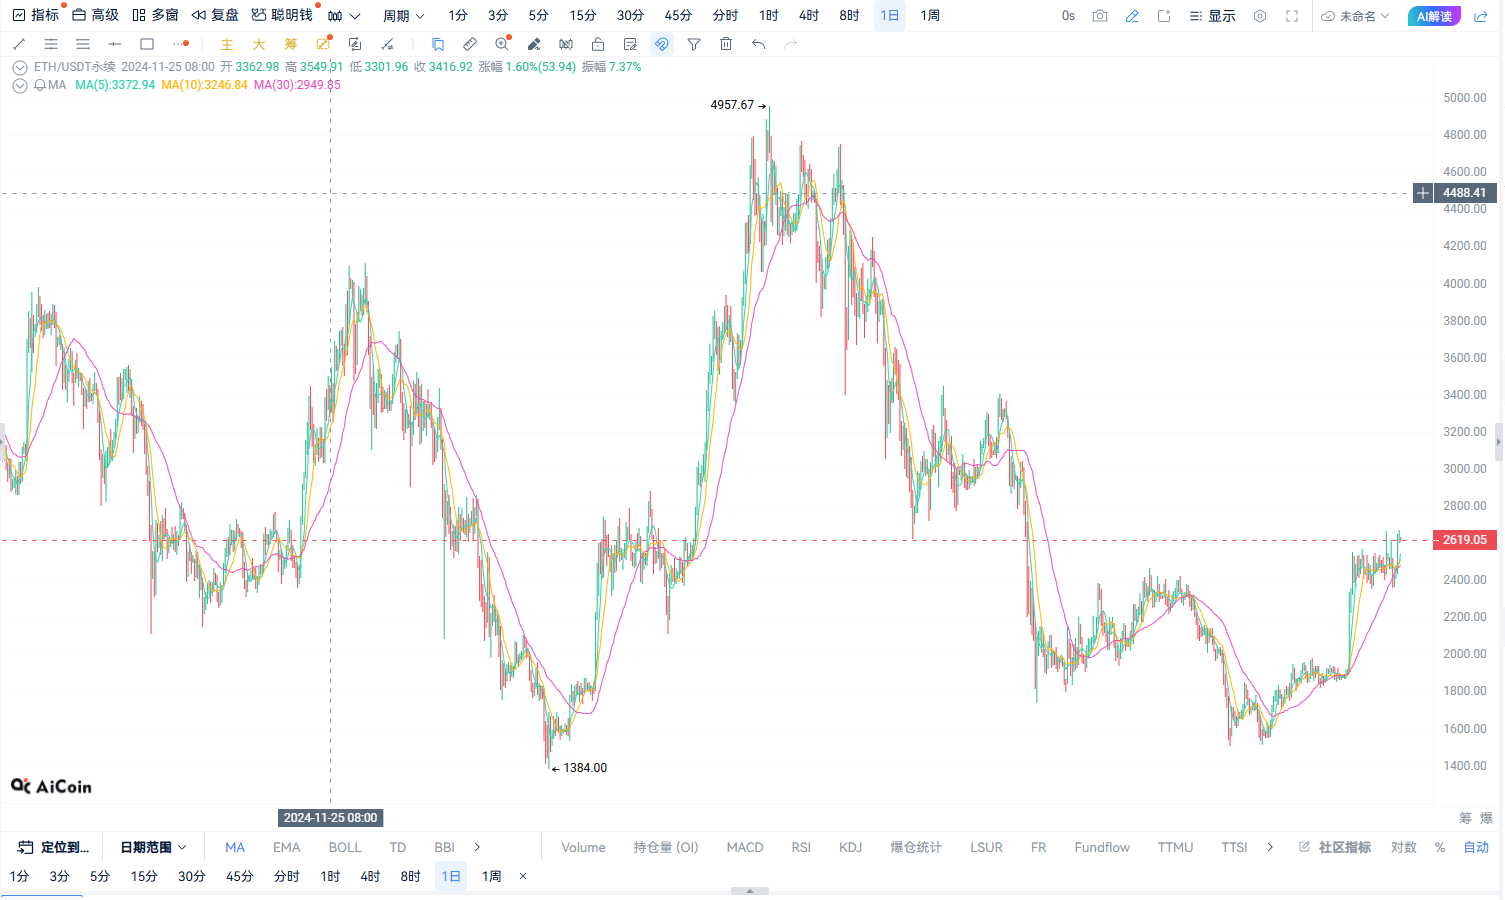
I. Daily chart (1D): It touched the previous high strong pressure zone; the long upper shadow reveals the main force distributing (selling).
Pattern and moving average system: Based on the K-line movement, after several consecutive upward pushes on the daily timeframe, the price directly touched the daily prior high and the core resistance band at 2650.00–2680.00. The K-line formed a Shooting Star (a long upper shadow) with a long upper wick, indicating extremely heavy selling pressure overhead and that the bulls can no longer hold the high ground.
Momentum indicators: The daily RSI has already surged into the 72 overbought zone, and momentum has shown serious weakening. Although the daily MACD fast and slow lines are still above the zero line, the growth of the red bars is clearly slowing down—an initial typical top divergence is forming: “price makes a new high, but the indicator does not make a new high.”
Key support/resistance: The main resistance above is concentrated at 2650.00 - 2660.00. The first daily line support is around 2550.00; if it breaks, it will open up room for a deep pullback toward 2480.00.
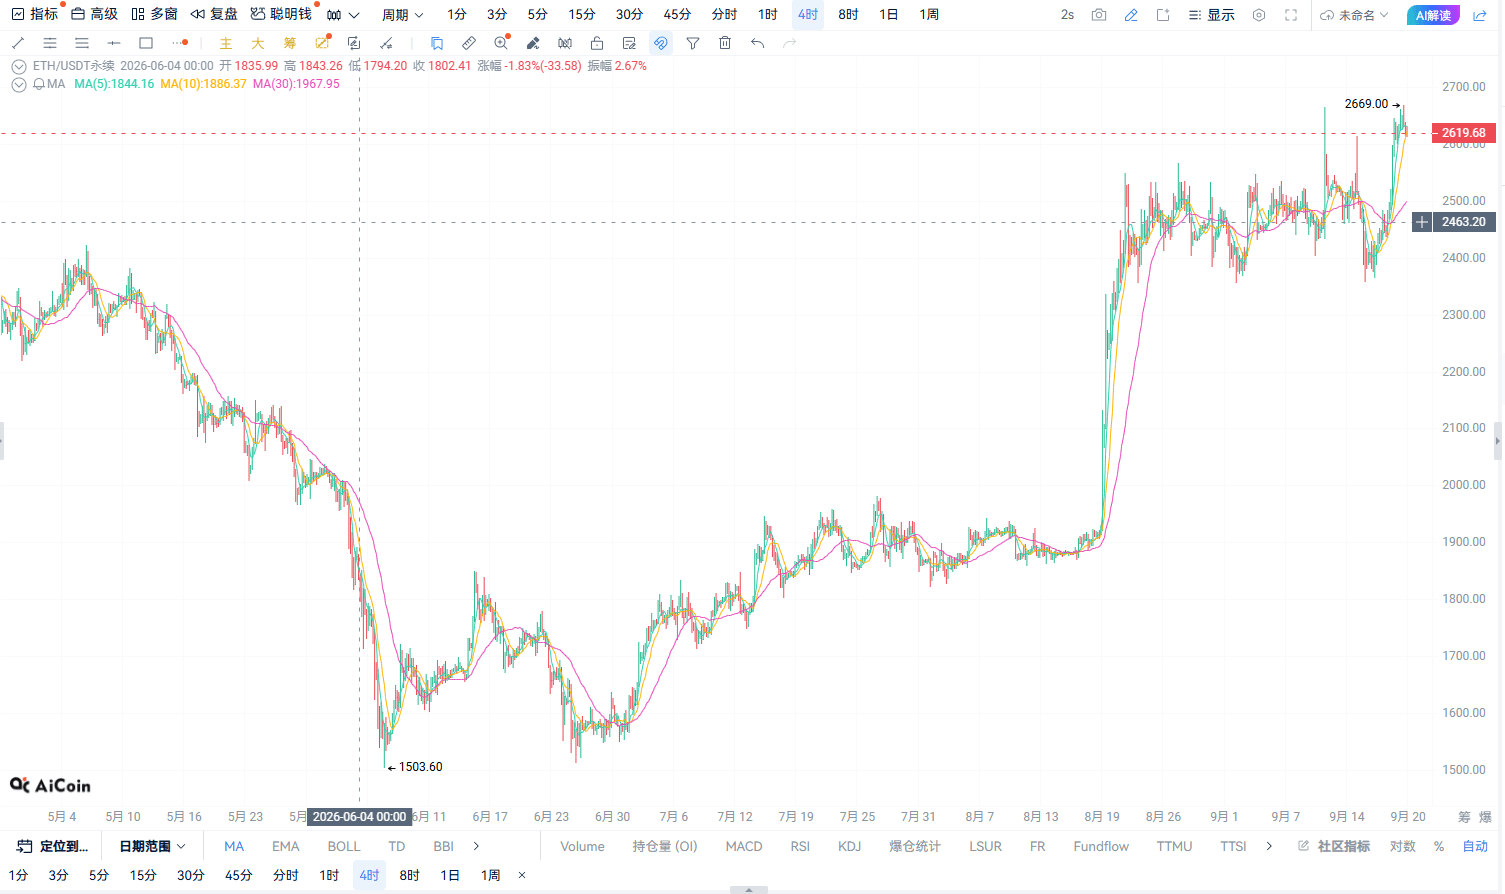
2. On the 4-hour chart (4H): The rising wedge has reached its end; the bull-trap shakeout is turning into a bear-trap selloff.
Pattern and moving average system: Based on the candlestick movement, the 4-hour timeframe is currently forming a standard bearish “rising wedge” termination pattern. After multiple failed attempts to break above the wedge’s upper band, the price quickly broke below the short-term EMA15 support, forming a bearish candlestick combination commonly referred to as “dark clouds covering the top.”
Price-volume relationship: When the price is at the high level of 2619.66, trading volume shows a sign of expansion with stalled gains. It is then followed by bearish candles pulling price down; volume continues to expand, indicating that the main funds are using short-term price spikes to disguise the profit-taking of large spot and futures long positions. The Bollinger Bands (Bollinger Bands) upper band narrows, and the mid-band support is precarious.
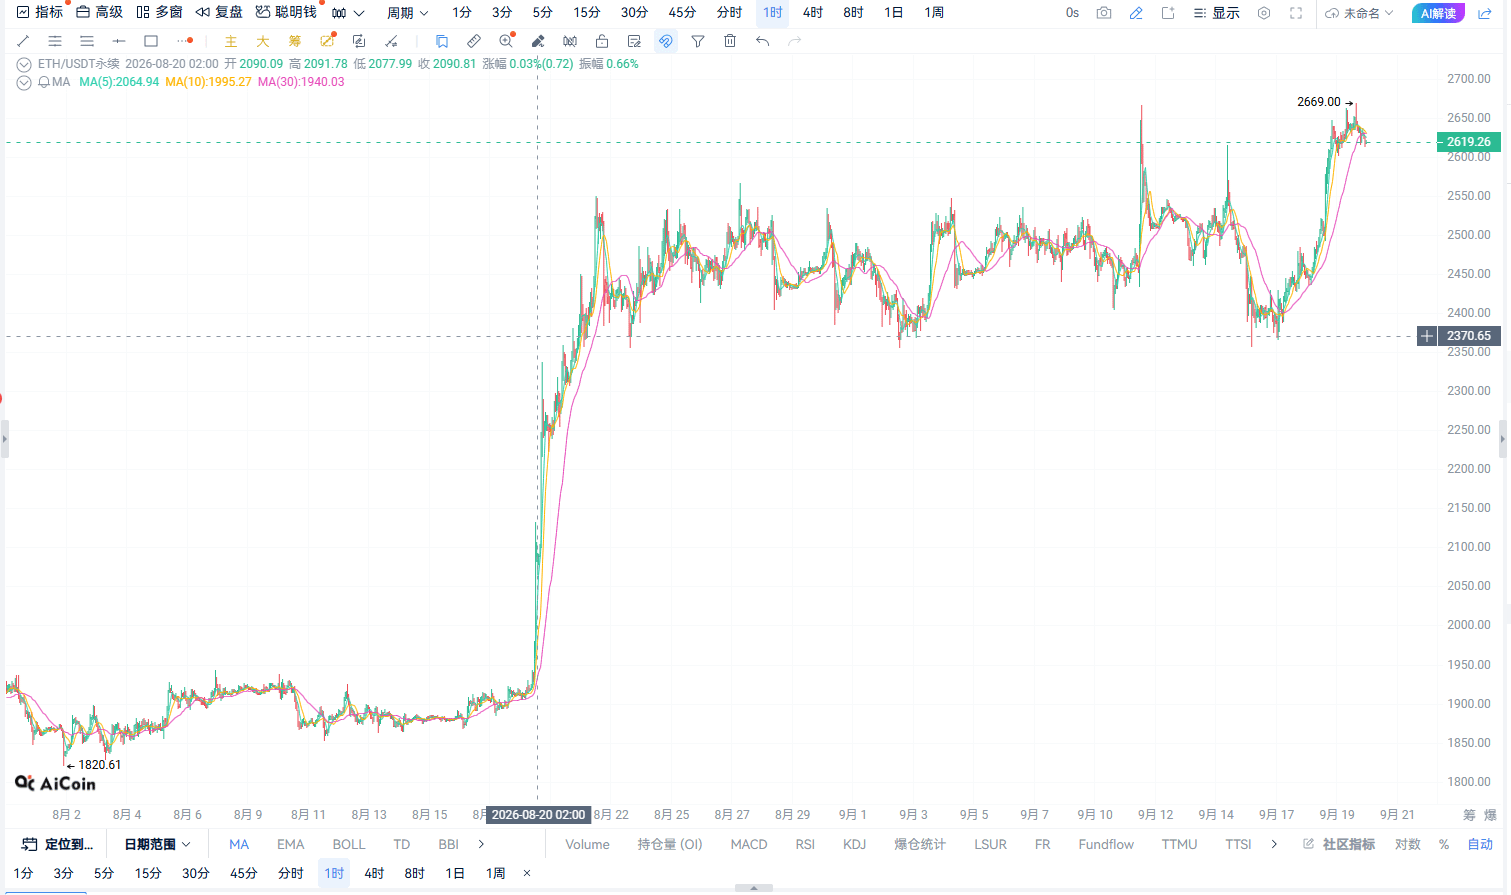
3. On the 1-hour chart (1H): A standard double top (M-head) has formed; a bearish breakdown is imminent.
Pattern and moving average system: On the 1-hour timeframe, after two failed breakouts around 2630.00, a standard micro “double top (M-head)” structure has been confirmed. The current price has already broken below the neckline; the short-term EMA15 and EMA30 have completed a bearish crossover and are tilting downward. The short side has fully taken control of the market in the short term.
Momentum indicators: The 1-hour MACD forms a bearish crossover above the zero line and quickly crosses below it; the opening of the bearish crossover continues to widen. The KDJ indicator’s three lines diverge sharply downward—an attack to accelerate the selloff in the very short term is imminent.
⚡ Real-time live trading strategy (open immediately at current price)
Based on the above 1-hour and 4-hour bearish resonance along with the high-level top divergence signals, the current position (2619.66) is an excellent high-win-rate/high-odds short entry point. It is recommended to open a short position directly at the current price!
Trading pair: $ETH /USDT (perpetual contract/spot)
Direction: Short (SHORT)
Entry price: 2619.66
Stop-loss price: 2658.95
First take-profit level: 2593.46
Second take-profit level: 2567.27
⚠️ Trading discipline reminder: Set a strict stop-loss and control position risk! After the first take-profit level is probed downward, it is recommended to reduce the position by 50% and move the remaining stop-loss to breakeven at the entry price (2619.66) to lock in profit—go for the second target without getting hurt!