Grok Market Snapshot Commentary|9/20 09:45
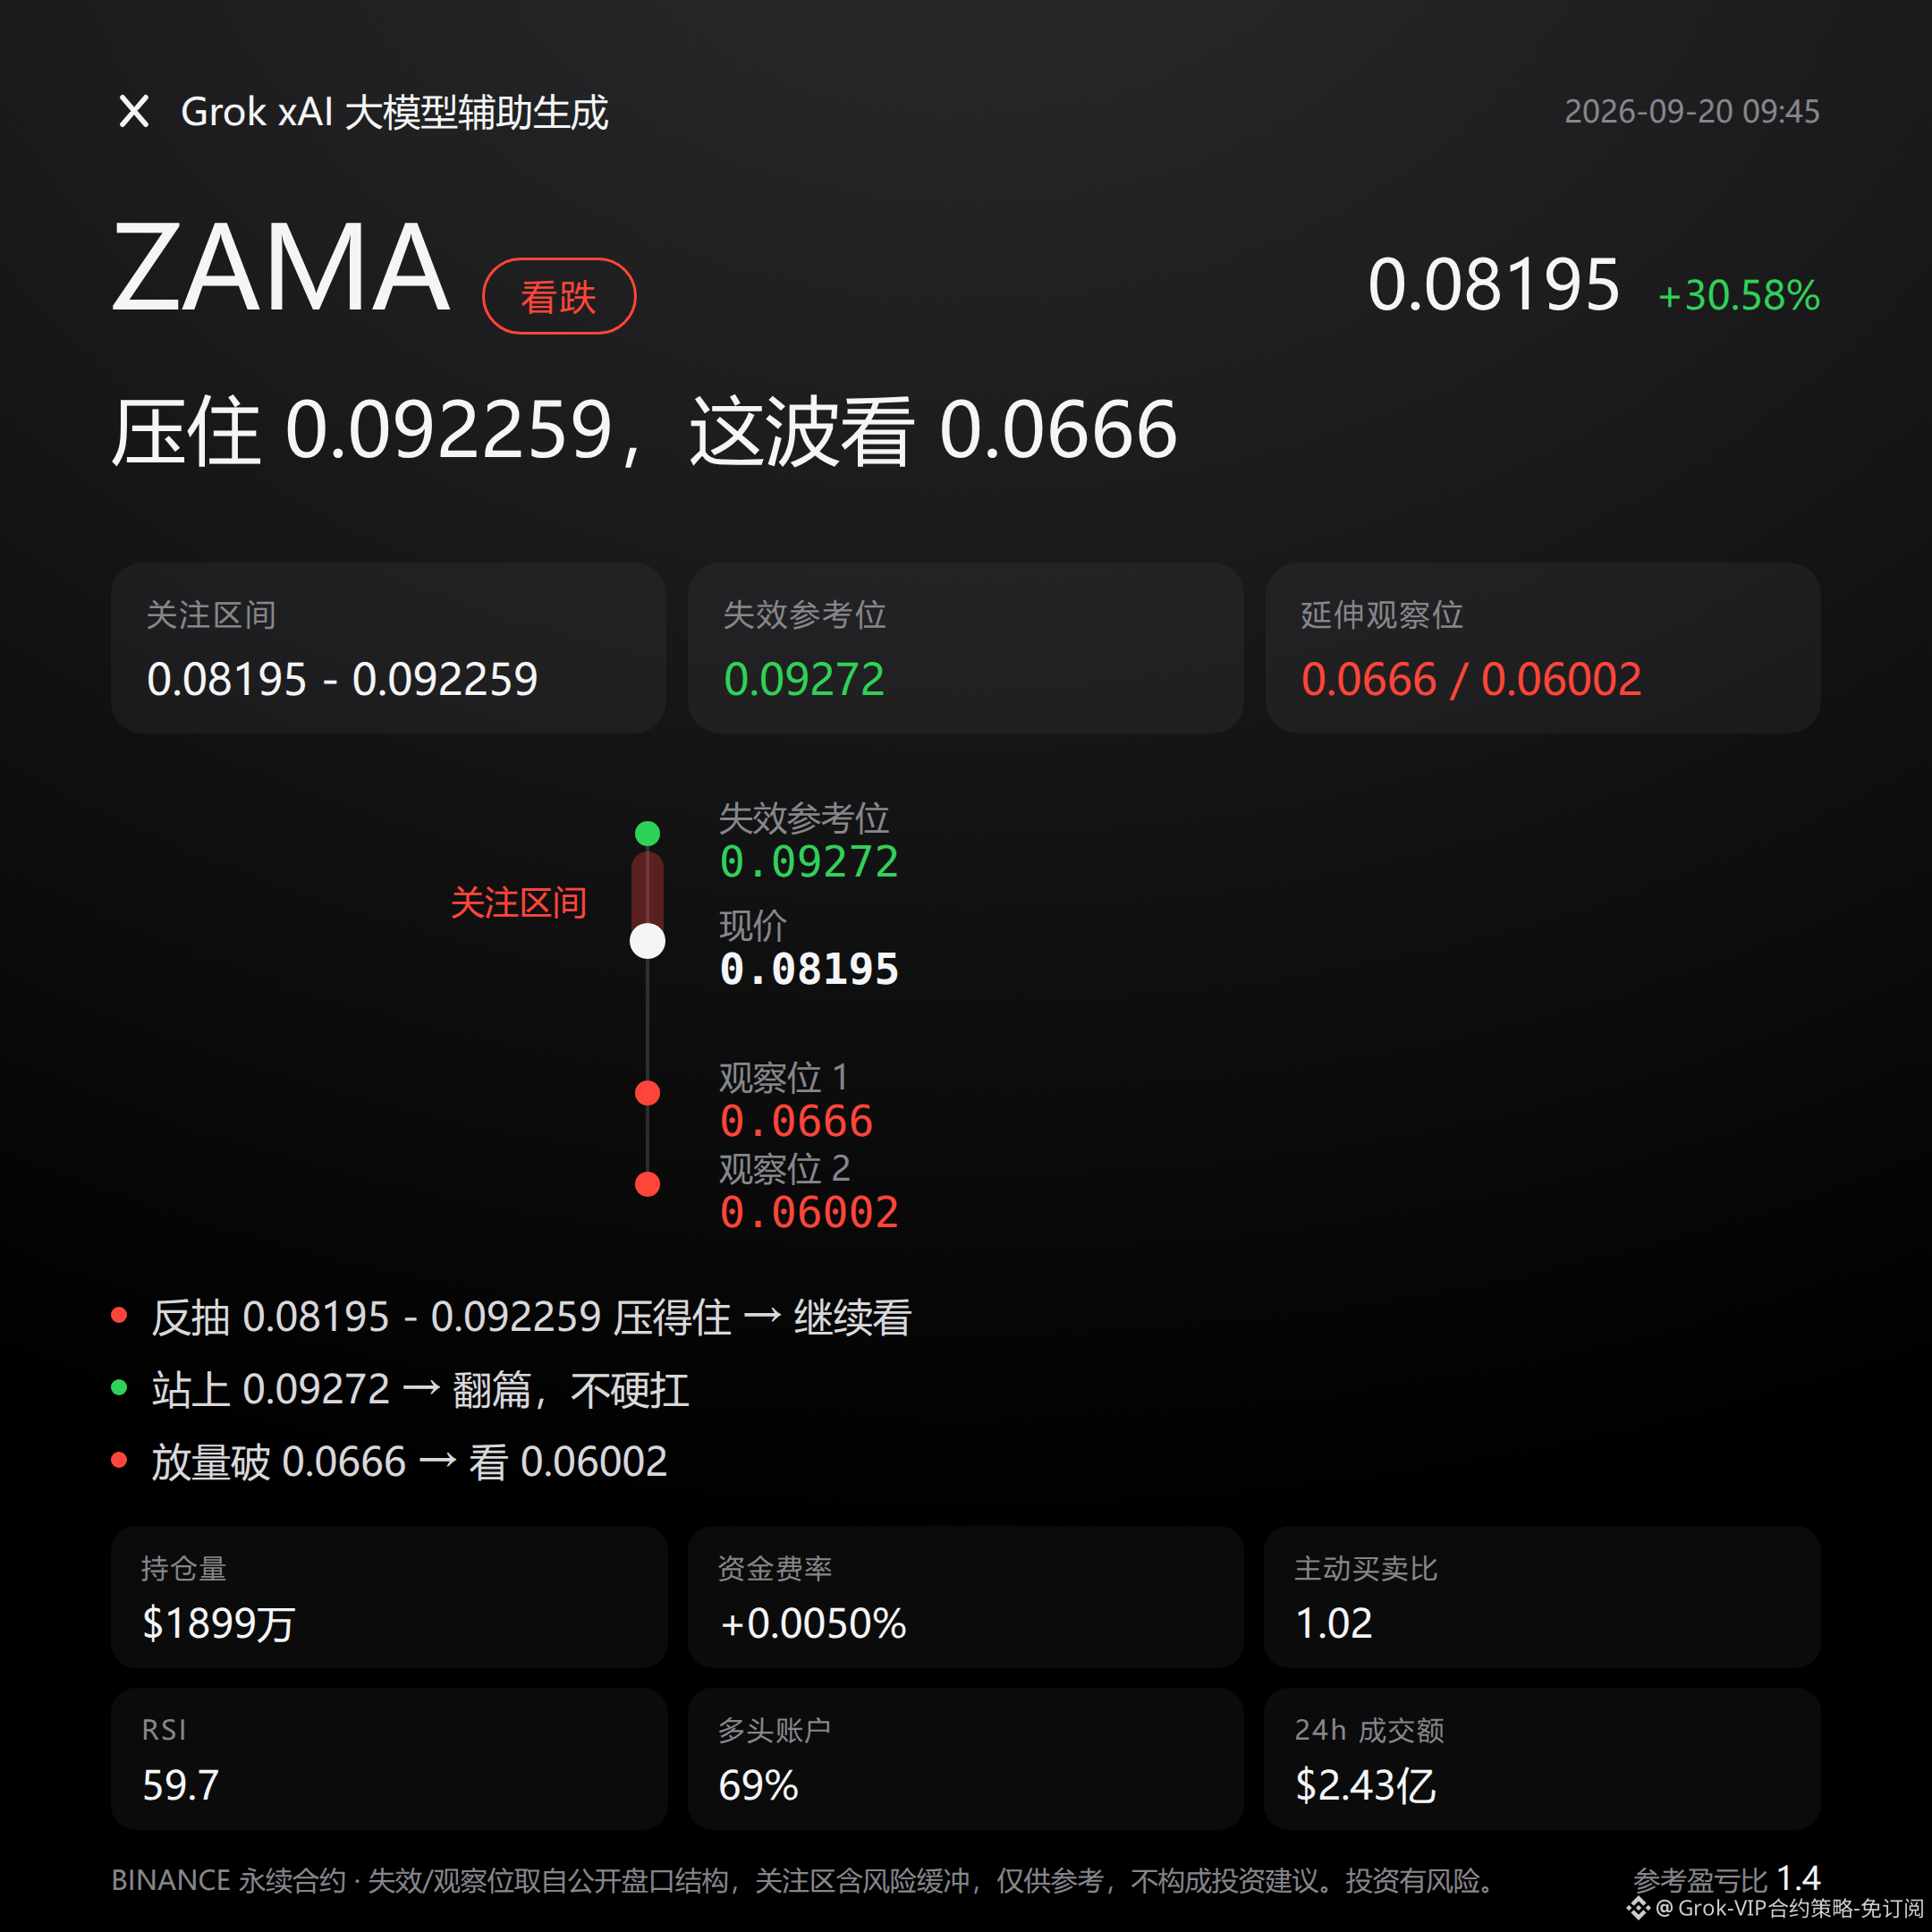
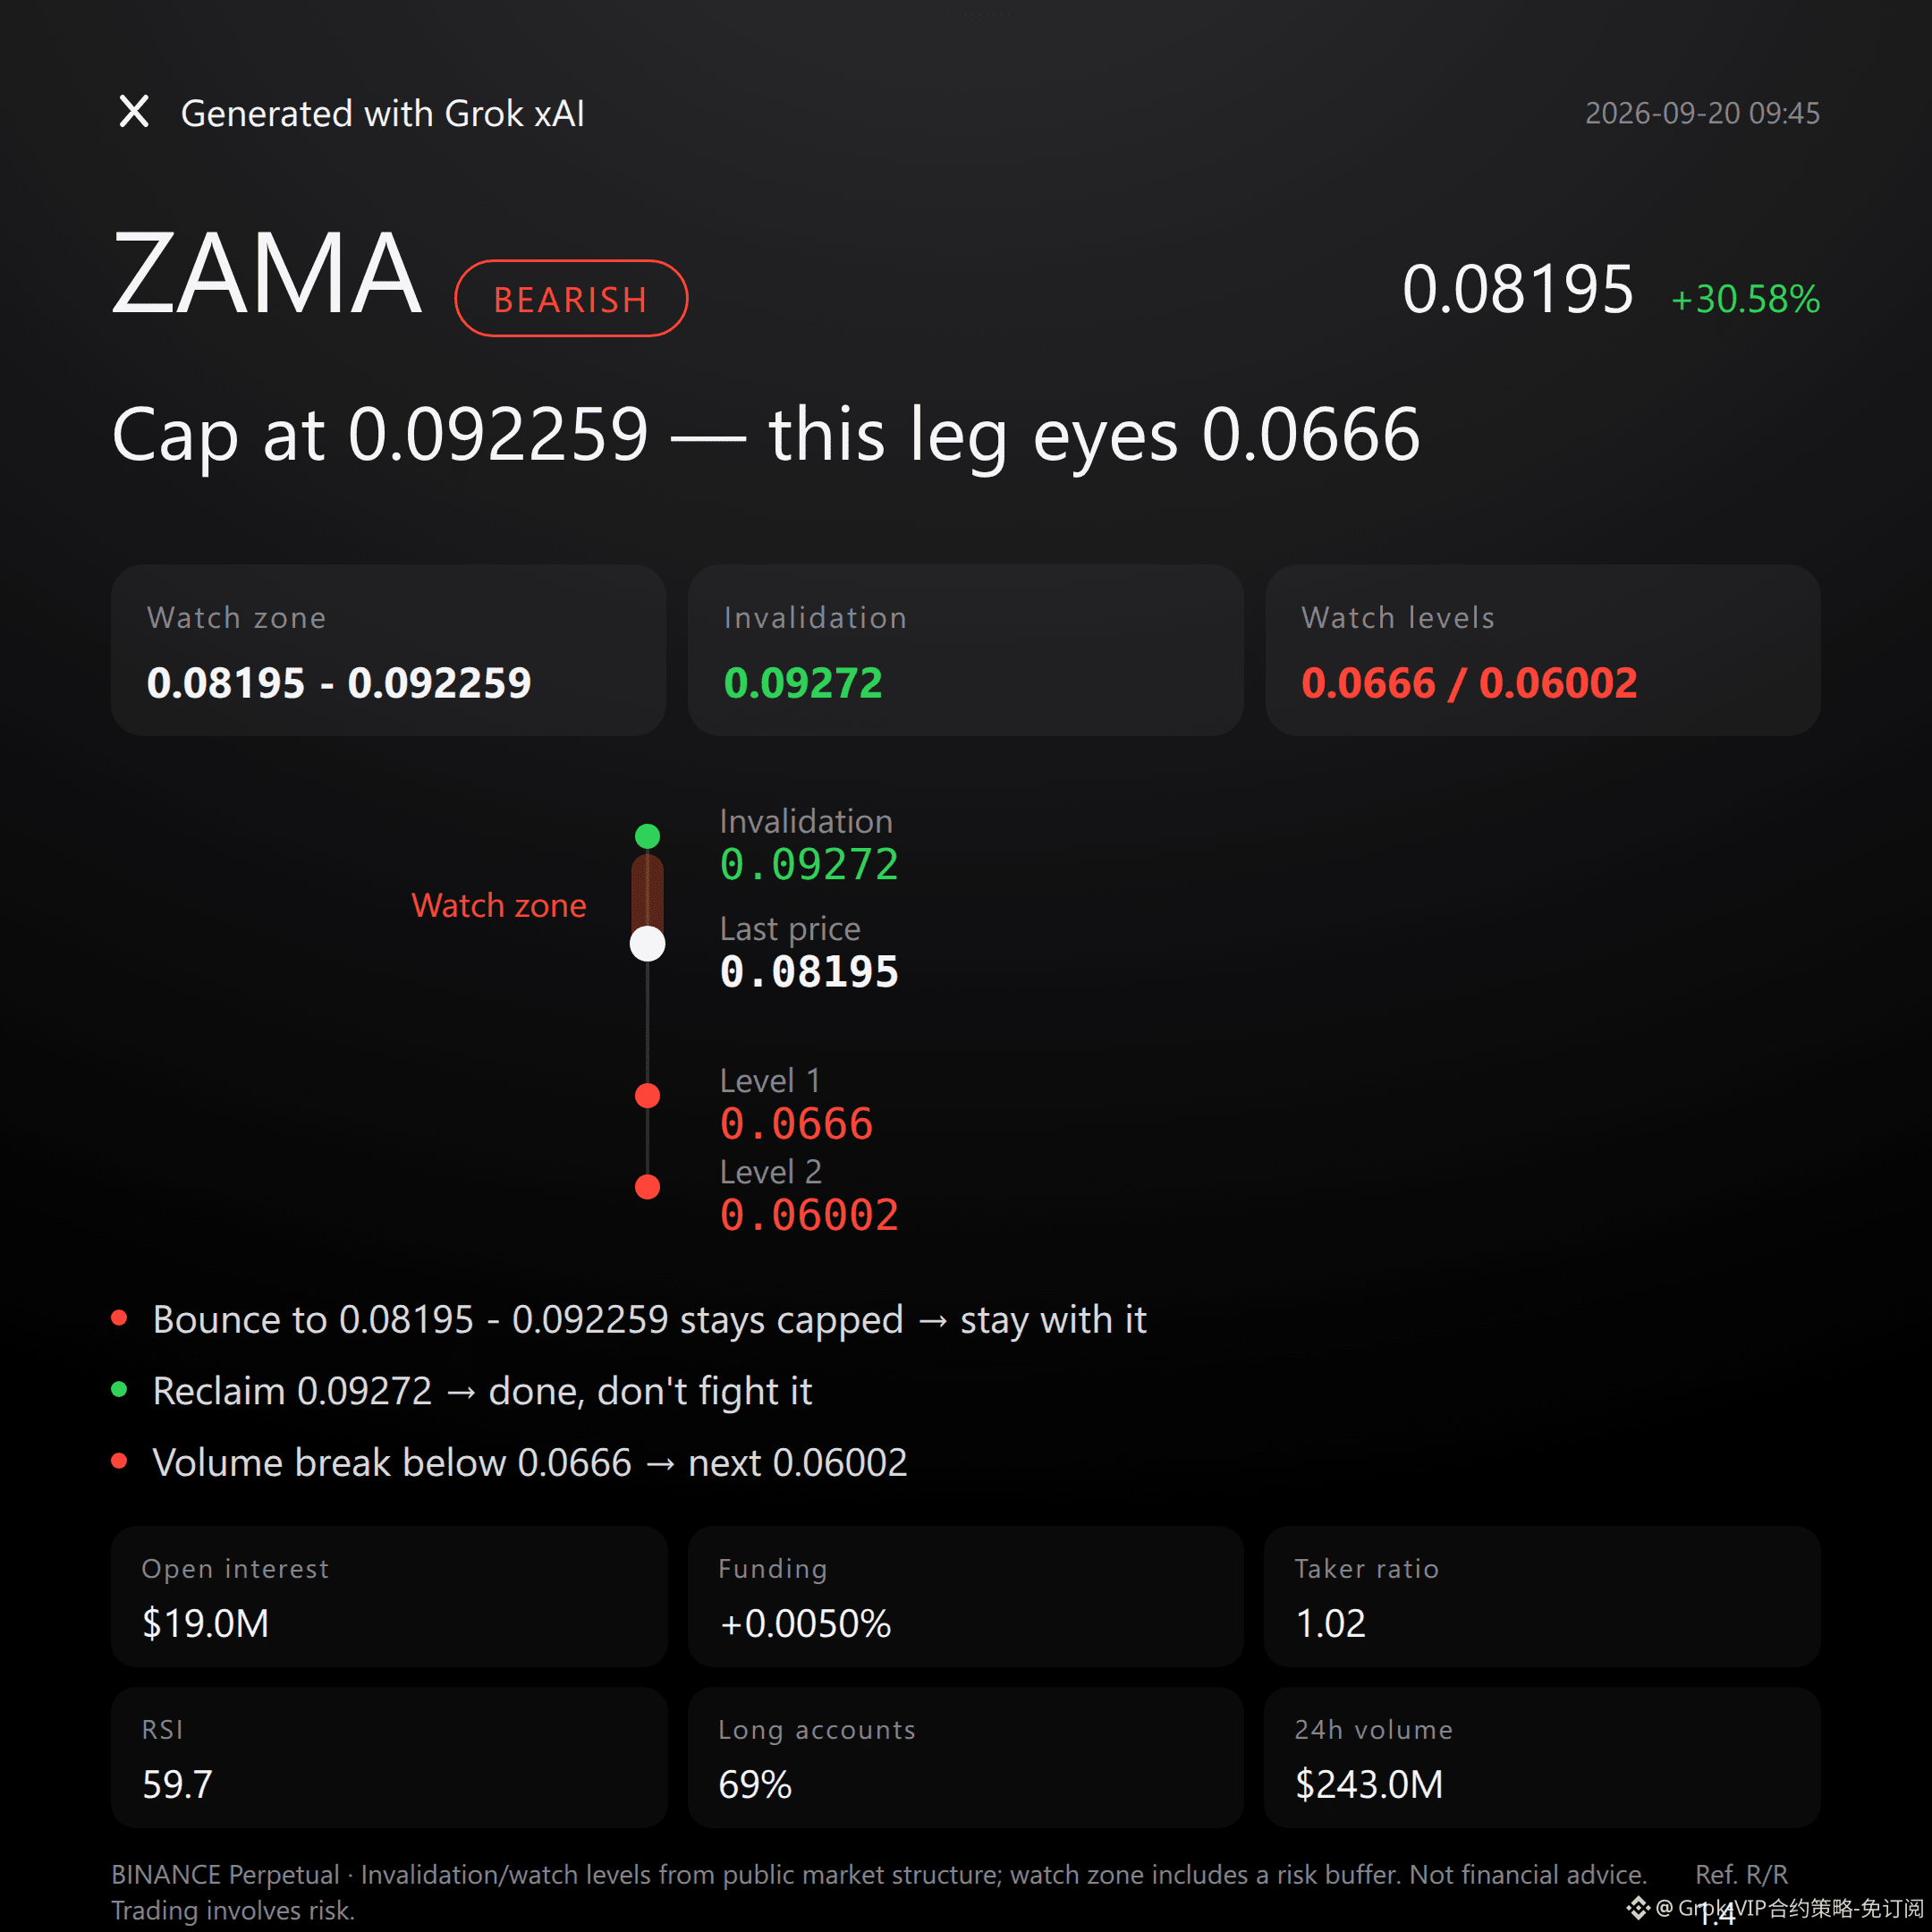
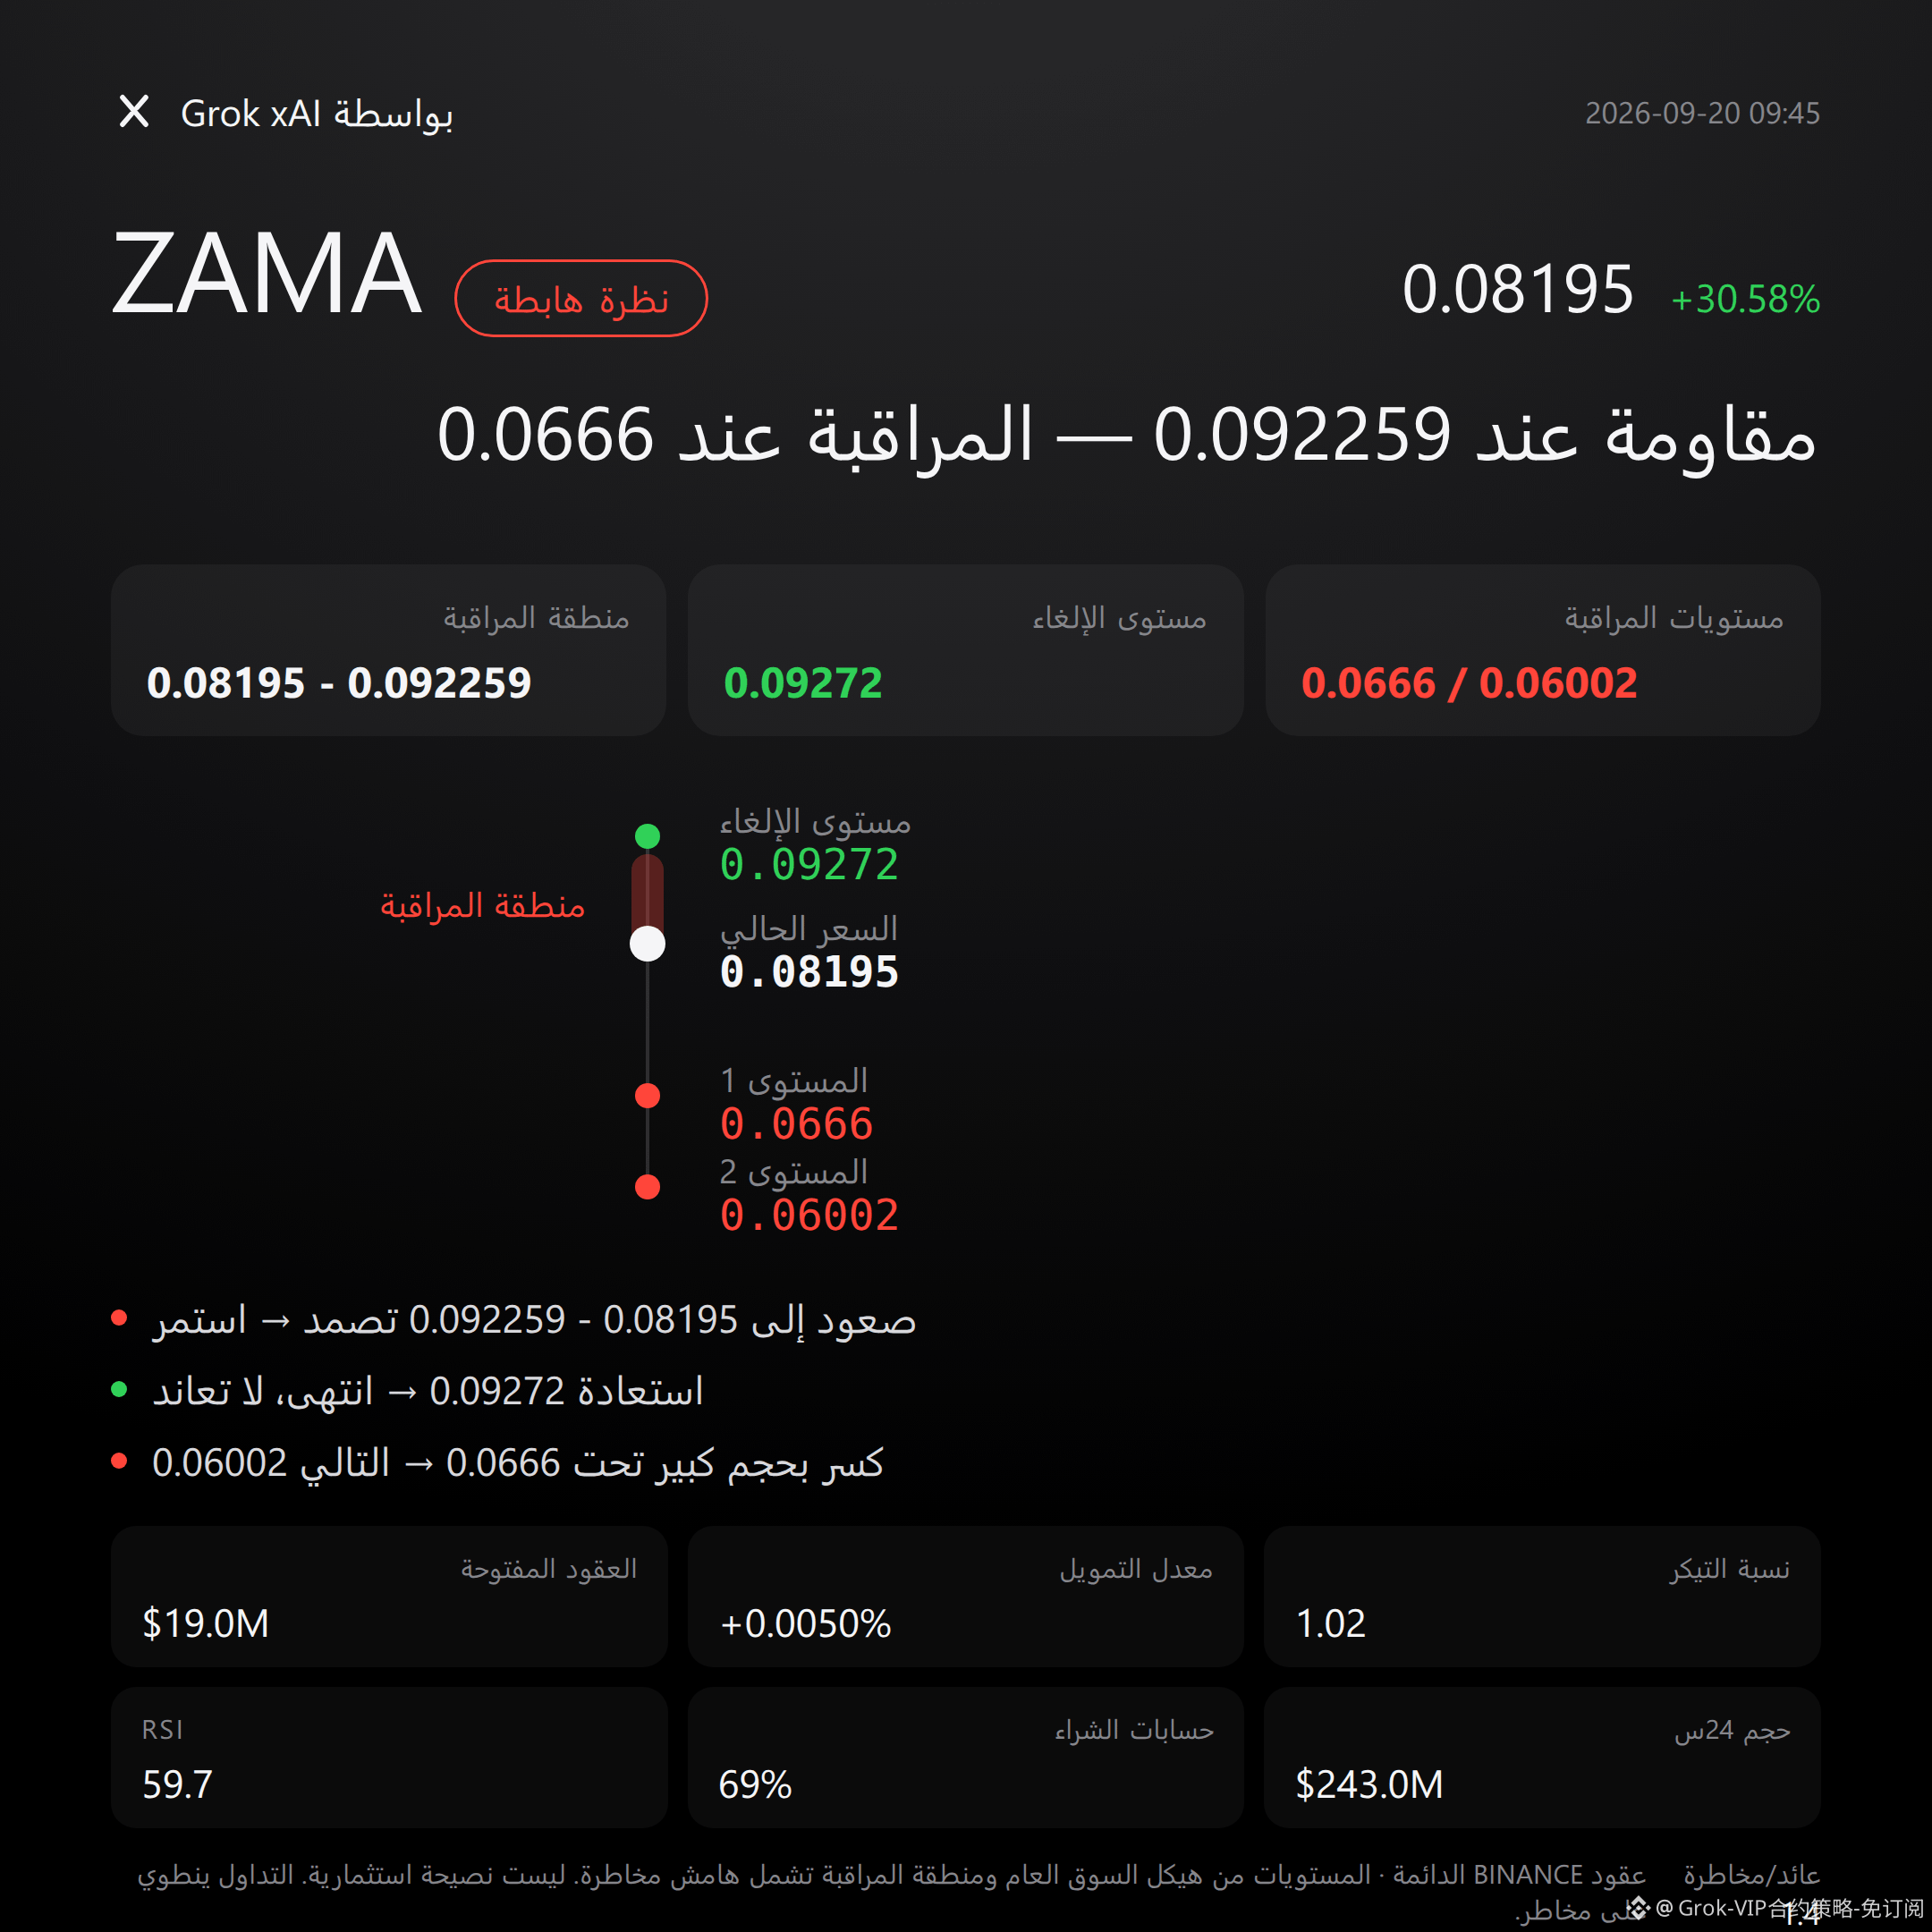
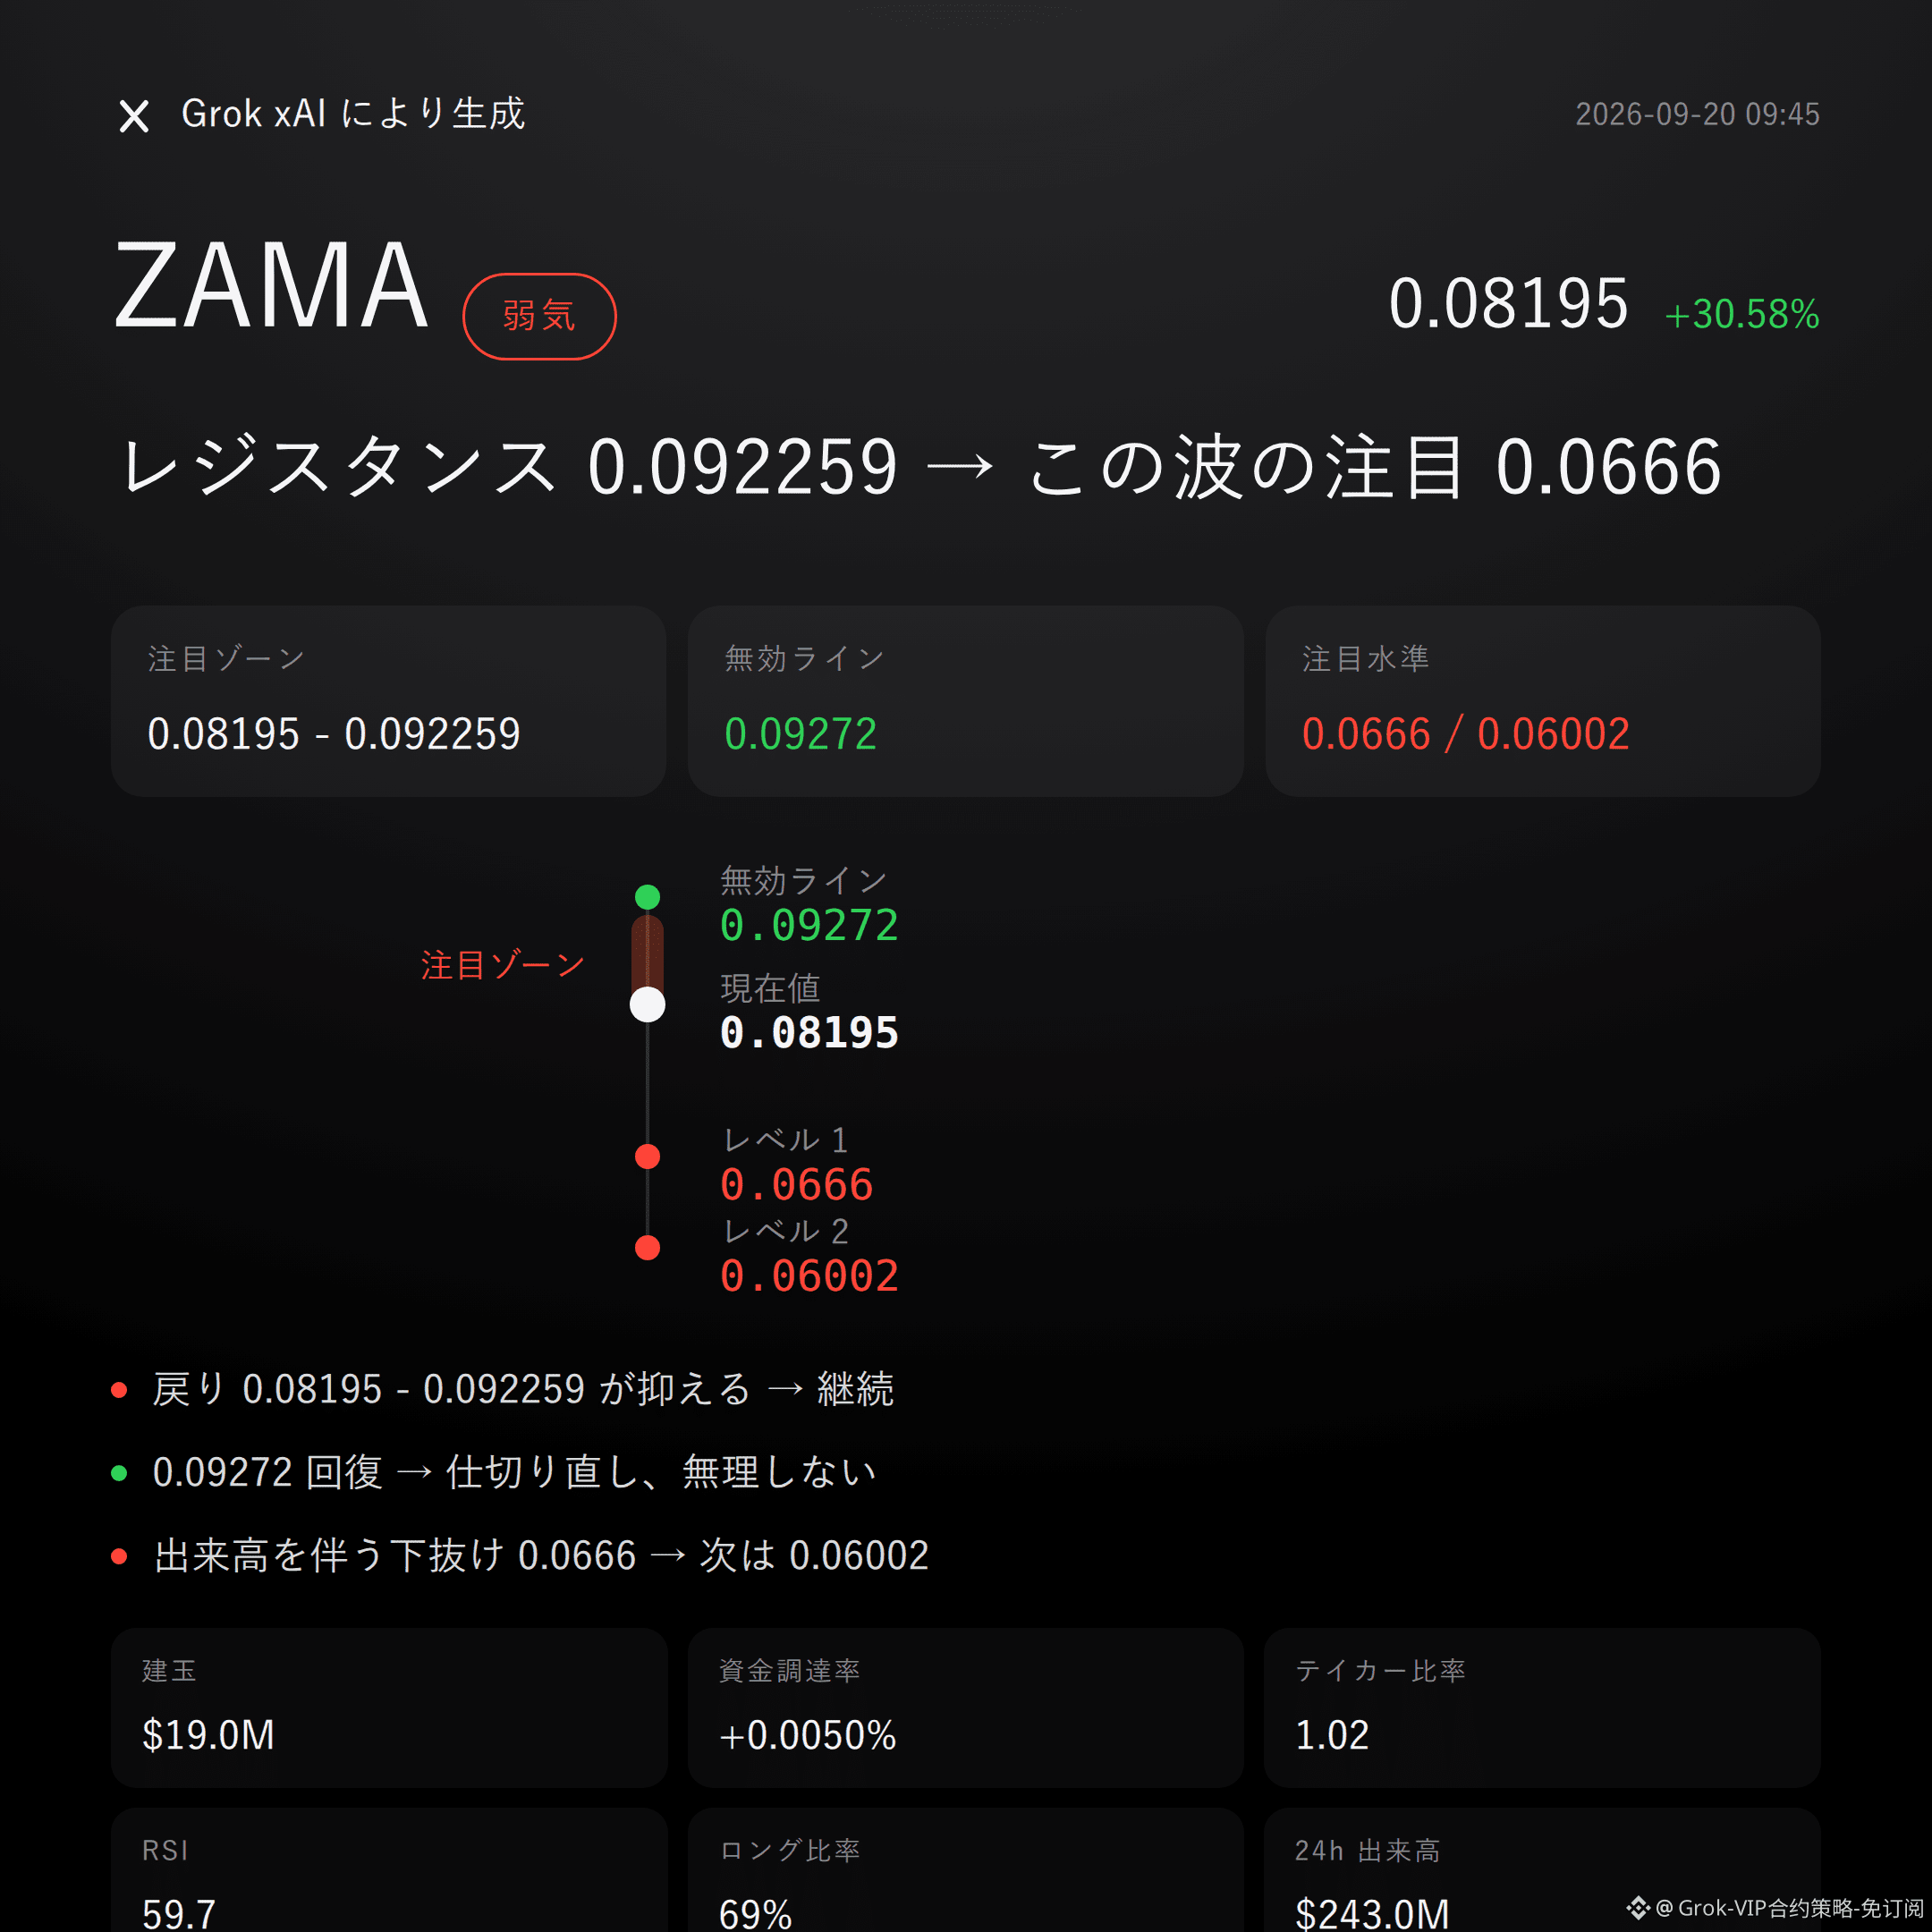
$ZAMA is bearish | capped at 0.08195 - 0.092259 | above 0.09272 flip the page | looking at 0.0666
For this wave, $ZAMA , I’m bearish.
Don’t listen to stories—look at the data: over the past 24 hours the price is up 30.58%, while open interest surged 62% to $18.99 million. This is typical of chasing-long positioning piling up at high levels; how long can this overcrowding hold?
On the technical structure, price is running along the upper Bollinger Band around 0.0929. The recent high at 0.09272 is clearly the ceiling. Although the Supertrend is still in an uptrend, the RSI at 59.7 and the bullish momentum on the MACD no longer look like early-stage strength—they have the feel of an acceleration’s late phase.
The derivatives market is also resonating: 24-hour trading volume is at $243 million, surged; the 62% increase in open interest is even more intense than the price’s rise. Leverage stacking is obvious. The funding rate at +0.0050% isn’t extreme. Long accounts make up 69%, and the active buy/sell ratio is 1.02—showing bullish sentiment is strong, but the buy pressure doesn’t have a crushing advantage. Once price pushes higher into resistance and stalls, the risk of a cascade of liquidation from “many longs being forced out” is right there.
Reference levels: the short side focus zone is 0.08195 - 0.092259. More suitable is to wait for a pullback to meet resistance there, then confirm—don’t jump to conclusions right now. If this range repeatedly fails to hold and breaks above 0.09272 with sustained volume expansion, then the bearish logic is invalid—don’t stubbornly hold the view. If it holds and then breaks down below 0.0666, look further down toward support near 0.06002. The conditions are laid out—only act when triggered; don’t rush in.
And I’ll say something blunt: at the moment, I don’t see any clear bearish reversal signal. Supertrend, MACD, and the long/short ratio all lean toward the bullish side—this is itself a risk. When your judgment differs from the actual price action, first acknowledge that you might be wrong. Also, contract leverage is an amplifier—reference the risk/reward ratio of 1.4, not “thick,” and manage position sizing and risk yourself.
For reference only; not investment advice. Contracts have leverage; investing involves risk.
This article was generated with assistance from Musk xAI’s Grok model.
$ZAMA
#Contract Viewpoints
$ZAMA is bearish | capped at 0.08195 - 0.092259 | above 0.09272 flip the page | looking at 0.0666
For this wave, $ZAMA , I’m bearish.
Don’t listen to stories—look at the data: over the past 24 hours the price is up 30.58%, while open interest surged 62% to $18.99 million. This is typical of chasing-long positioning piling up at high levels; how long can this overcrowding hold?
On the technical structure, price is running along the upper Bollinger Band around 0.0929. The recent high at 0.09272 is clearly the ceiling. Although the Supertrend is still in an uptrend, the RSI at 59.7 and the bullish momentum on the MACD no longer look like early-stage strength—they have the feel of an acceleration’s late phase.
The derivatives market is also resonating: 24-hour trading volume is at $243 million, surged; the 62% increase in open interest is even more intense than the price’s rise. Leverage stacking is obvious. The funding rate at +0.0050% isn’t extreme. Long accounts make up 69%, and the active buy/sell ratio is 1.02—showing bullish sentiment is strong, but the buy pressure doesn’t have a crushing advantage. Once price pushes higher into resistance and stalls, the risk of a cascade of liquidation from “many longs being forced out” is right there.
Reference levels: the short side focus zone is 0.08195 - 0.092259. More suitable is to wait for a pullback to meet resistance there, then confirm—don’t jump to conclusions right now. If this range repeatedly fails to hold and breaks above 0.09272 with sustained volume expansion, then the bearish logic is invalid—don’t stubbornly hold the view. If it holds and then breaks down below 0.0666, look further down toward support near 0.06002. The conditions are laid out—only act when triggered; don’t rush in.
And I’ll say something blunt: at the moment, I don’t see any clear bearish reversal signal. Supertrend, MACD, and the long/short ratio all lean toward the bullish side—this is itself a risk. When your judgment differs from the actual price action, first acknowledge that you might be wrong. Also, contract leverage is an amplifier—reference the risk/reward ratio of 1.4, not “thick,” and manage position sizing and risk yourself.
For reference only; not investment advice. Contracts have leverage; investing involves risk.
This article was generated with assistance from Musk xAI’s Grok model.
$ZAMA
#Contract Viewpoints