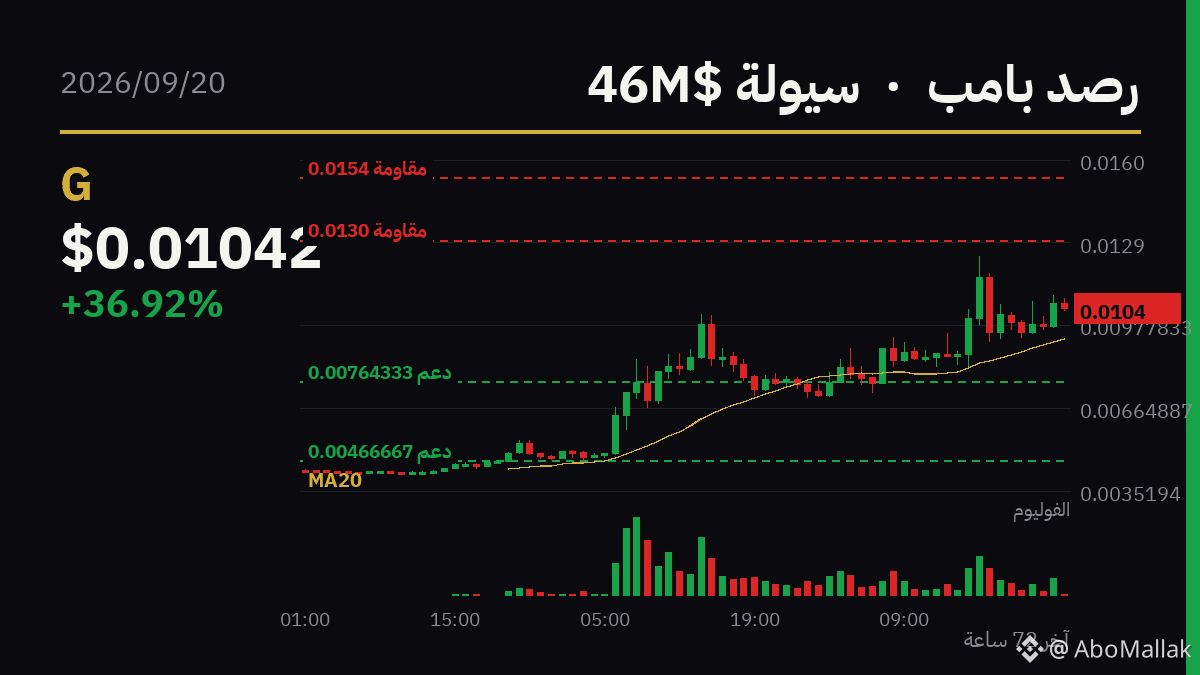

🚀 Bomb Watch: $G is up +36.8% in 24 hours
Momentum Power: 78/100
✅ Liquidity $46M | ✅ Holding 95% of its peak | ✅ Volume is accompanying
▪️ Price right now: $0.01042
📊 Levels controlling the move:
▪️ Staying above $0.0076433333 = the move is still ongoing
▪️ Breaking above $0.012993 = the door to continuation is open
▪️ Falling back below $0.0076146212 (the start of the wave) = consider it finished
**Analytical Watch – G Coin Move**
The G coin recorded a notable jump of +36.8% over the past 24 hours, supported by strong liquidity of $46 million, with the price currently at $0.01042.
Continuation of the upward momentum depends on the price’s ability to break the nearby resistance level at $0.012993 with increasing trading volume, which would open the door for the wave of interest in the coin to continue.
On the other hand, the move may lose its driving force if the price fails to surpass that resistance and turns downward—especially if it breaks the support level at $0.0076433333, which would signal a decline in momentum and weakening interest from liquidity to keep the rally going.
Monitoring liquidity and volume over the coming hours is the most important indicator to determine which of the two scenarios is more likely.
Is the move still going, or is this the top? The chart is in front of you 👇 $G
⚠️ These pump moves move violently in both directions—entering late is more dangerous than missing it
📉 Market around it: $BTC is moving +0.5% in the same hours.
💛 Join Abu Malik’s team: Register on Binance with code ABOMALAK — permanent discount on trading fees and benefit from our services and offers
#BTC #Altcoins #Digital_Currencies
⚠️ Educational content for follow-up — not investment advice; your decision is your responsibility
Momentum Power: 78/100
✅ Liquidity $46M | ✅ Holding 95% of its peak | ✅ Volume is accompanying
▪️ Price right now: $0.01042
📊 Levels controlling the move:
▪️ Staying above $0.0076433333 = the move is still ongoing
▪️ Breaking above $0.012993 = the door to continuation is open
▪️ Falling back below $0.0076146212 (the start of the wave) = consider it finished
**Analytical Watch – G Coin Move**
The G coin recorded a notable jump of +36.8% over the past 24 hours, supported by strong liquidity of $46 million, with the price currently at $0.01042.
Continuation of the upward momentum depends on the price’s ability to break the nearby resistance level at $0.012993 with increasing trading volume, which would open the door for the wave of interest in the coin to continue.
On the other hand, the move may lose its driving force if the price fails to surpass that resistance and turns downward—especially if it breaks the support level at $0.0076433333, which would signal a decline in momentum and weakening interest from liquidity to keep the rally going.
Monitoring liquidity and volume over the coming hours is the most important indicator to determine which of the two scenarios is more likely.
Is the move still going, or is this the top? The chart is in front of you 👇 $G
⚠️ These pump moves move violently in both directions—entering late is more dangerous than missing it
📉 Market around it: $BTC is moving +0.5% in the same hours.
💛 Join Abu Malik’s team: Register on Binance with code ABOMALAK — permanent discount on trading fees and benefit from our services and offers
#BTC #Altcoins #Digital_Currencies
⚠️ Educational content for follow-up — not investment advice; your decision is your responsibility