Observe the fluctuation of $G around the resistance zone
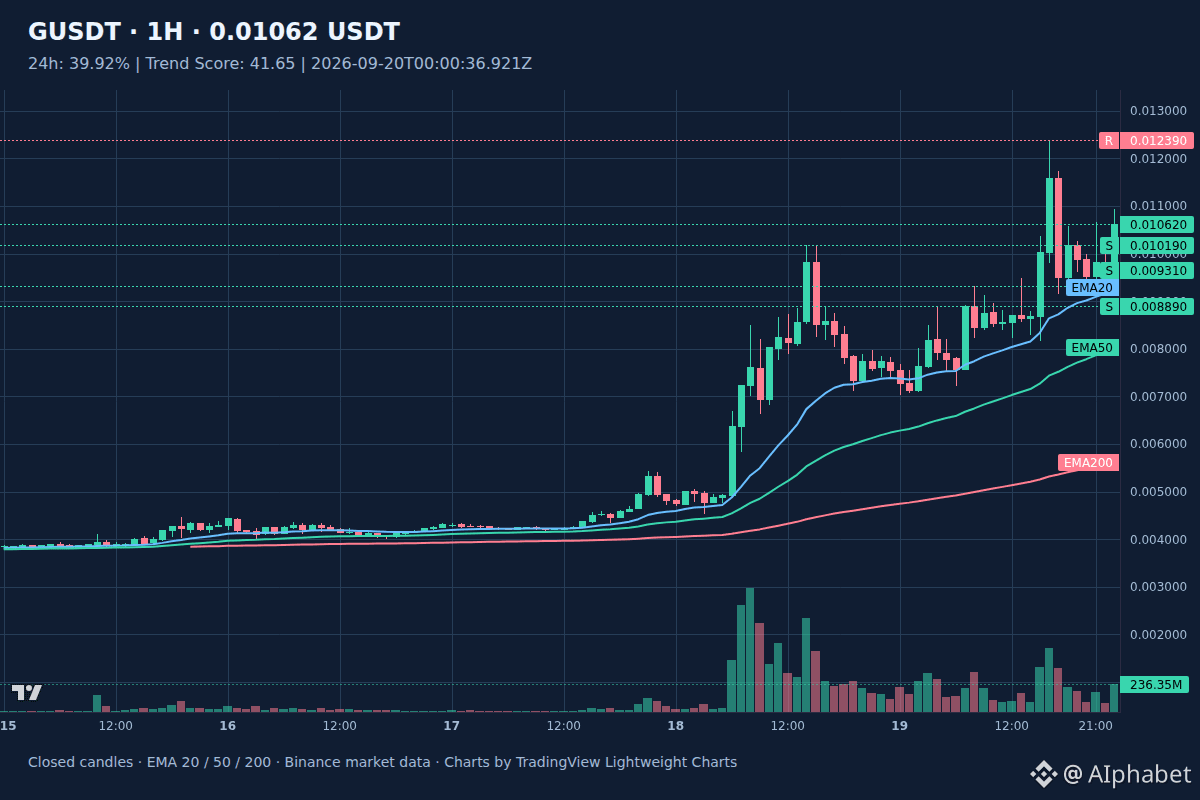
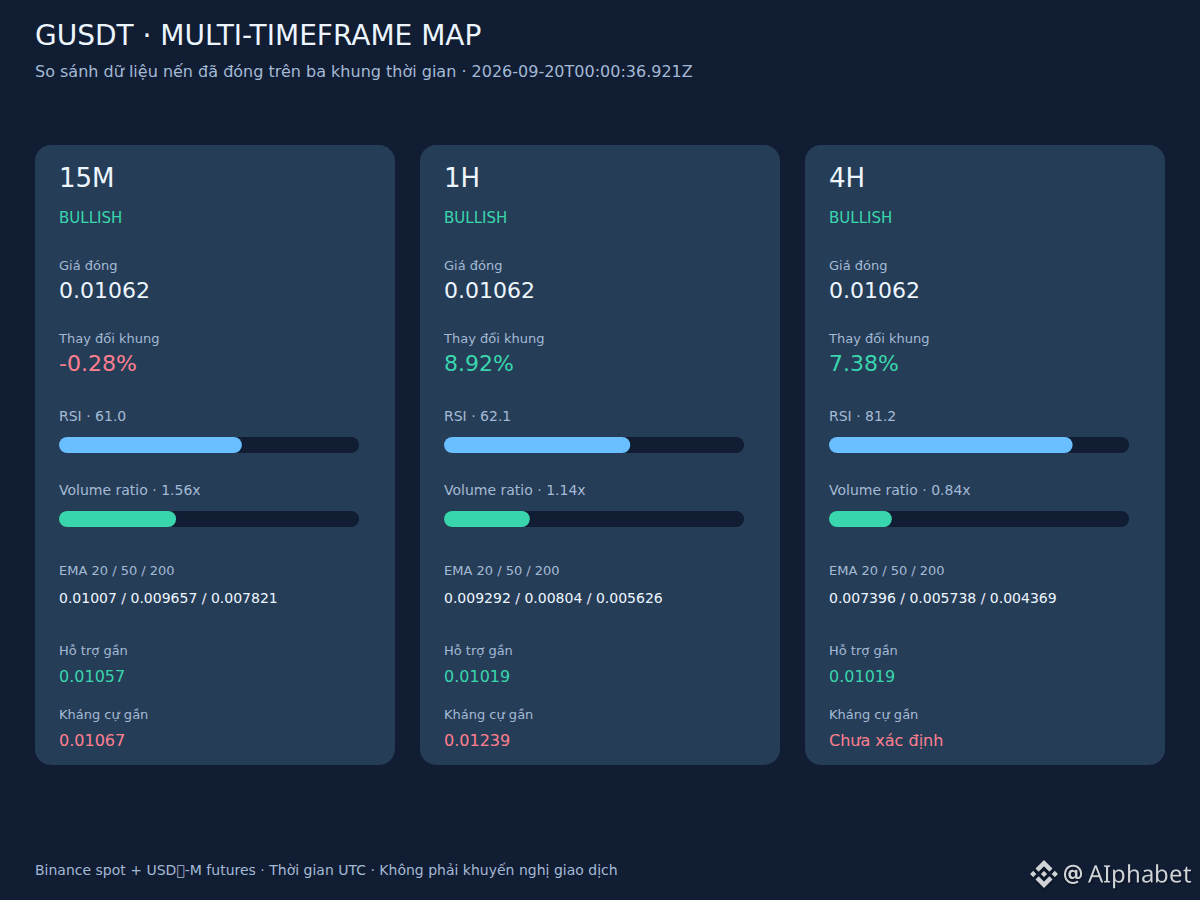
Let’s look at the chart to see that $G is currently testing the resistance area of 0.01067 with impressive growth momentum during the day. $G is hovering at 0.01062, while the 4-hour RSI rises to 81.2, reflecting a fairly strong push but also nearing the overbought zone. On the 1-hour timeframe, the EMA lines continue to stack upward, supporting the prevailing trend.
If capital inflow continues and helps the price break above 0.01067, the uptrend may extend toward higher levels—like a ship sailing with favorable winds encountering strong gusts. Conversely, a pullback scenario could unfold if profit-taking pressure increases around the current price area. If the price turns and falls below the support level of 0.01019, sellers may test deeper buffer zones further down.
Note that an overbought condition on the higher timeframe may trigger unexpected shakeouts at any time. 📊
#Crypto #GUSDT
Let’s look at the chart to see that $G is currently testing the resistance area of 0.01067 with impressive growth momentum during the day. $G is hovering at 0.01062, while the 4-hour RSI rises to 81.2, reflecting a fairly strong push but also nearing the overbought zone. On the 1-hour timeframe, the EMA lines continue to stack upward, supporting the prevailing trend.
If capital inflow continues and helps the price break above 0.01067, the uptrend may extend toward higher levels—like a ship sailing with favorable winds encountering strong gusts. Conversely, a pullback scenario could unfold if profit-taking pressure increases around the current price area. If the price turns and falls below the support level of 0.01019, sellers may test deeper buffer zones further down.
Note that an overbought condition on the higher timeframe may trigger unexpected shakeouts at any time. 📊
#Crypto #GUSDT