#XTZ
📊 TECHNICAL ANALYSIS MONITORING — BUY | XTZUSDT 1H
🟢 SCENARIO IN MONITORING: BUY
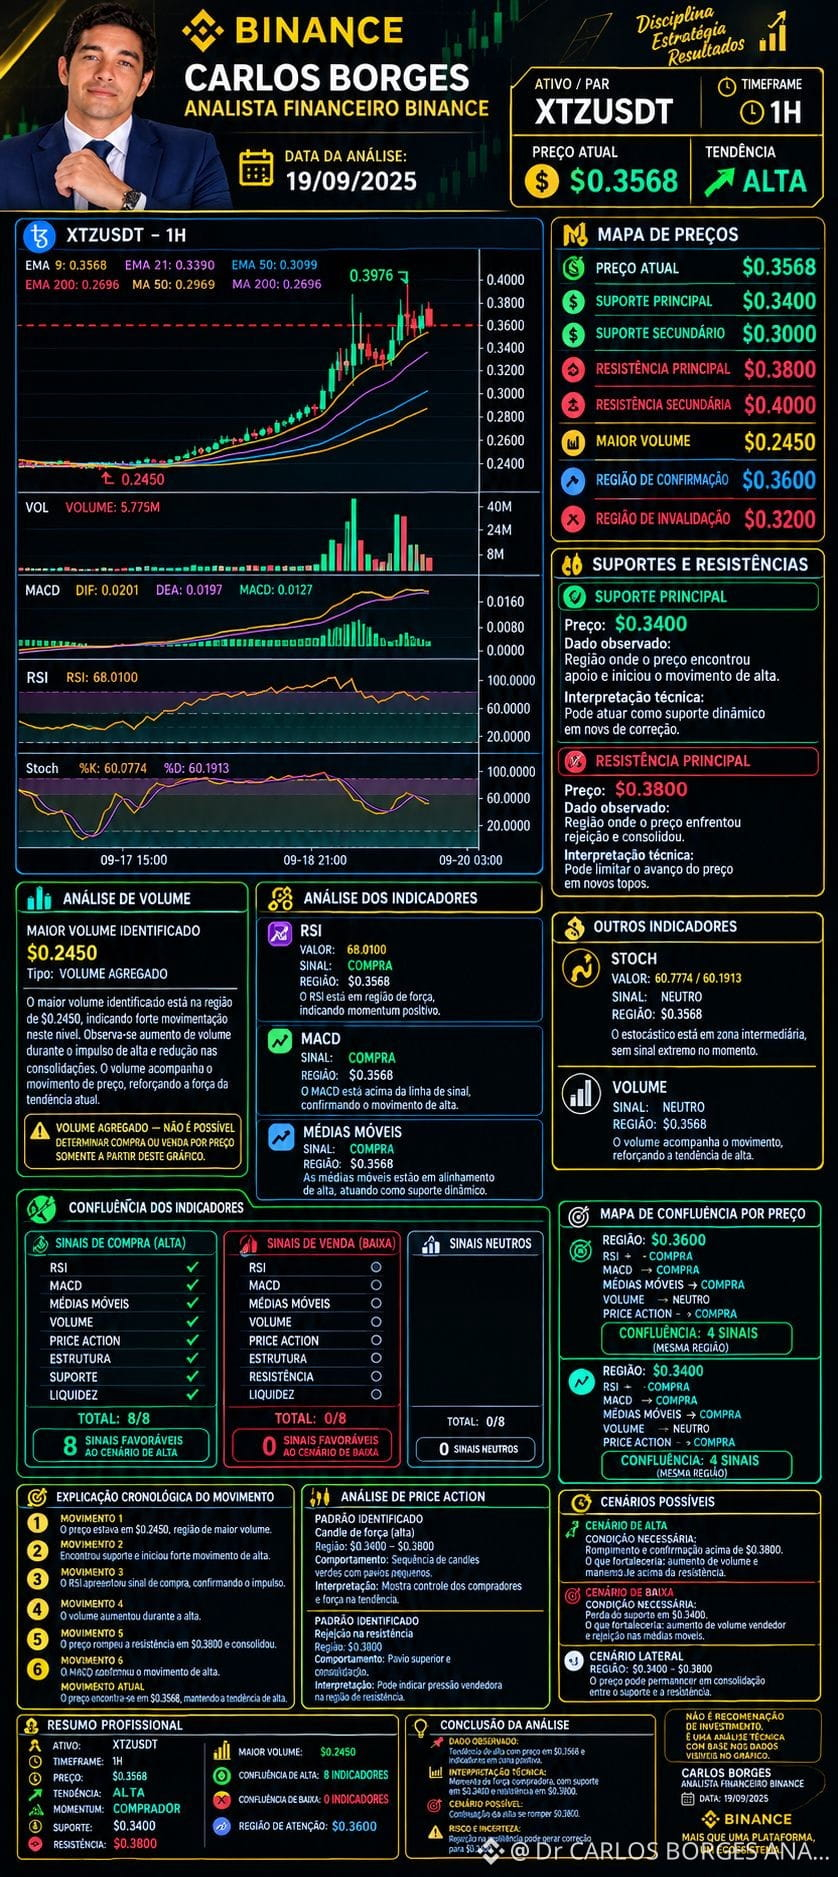
On the 1H chart, XTZUSDT shows a bullish structure, with the price trading above the main moving averages. The monitoring aims to confirm the continuation of the buying move before any entry.
🔎 POINTS TO WATCH
💰 Observed price: US$ 0,3568
🟢 Relevant support: US$ 0,3400
🔴 Resistance: US$ 0,3800
📈 RSI: 68.01, close to the overbought region
📊 MACD: positive, indicating bullish momentum
📈 Moving averages: aligned in favor of the bullish structure
📊 Volume: significant increase during the appreciation move
🎯 CONFIRMATION The monitoring remains focused on a possible buy if the price shows support of the structure and confirmation above the resistance regions.
⚠️ RISK A rejection at resistance or a loss of support at US$ 0,3400 may weaken the bullish scenario. Technical analysis does not guarantee results.
CARLOS BORGES FINANCIAL ANALYST BINANCE
📊 TECHNICAL ANALYSIS MONITORING — BUY | XTZUSDT 1H
🟢 SCENARIO IN MONITORING: BUY
On the 1H chart, XTZUSDT shows a bullish structure, with the price trading above the main moving averages. The monitoring aims to confirm the continuation of the buying move before any entry.
🔎 POINTS TO WATCH
💰 Observed price: US$ 0,3568
🟢 Relevant support: US$ 0,3400
🔴 Resistance: US$ 0,3800
📈 RSI: 68.01, close to the overbought region
📊 MACD: positive, indicating bullish momentum
📈 Moving averages: aligned in favor of the bullish structure
📊 Volume: significant increase during the appreciation move
🎯 CONFIRMATION The monitoring remains focused on a possible buy if the price shows support of the structure and confirmation above the resistance regions.
⚠️ RISK A rejection at resistance or a loss of support at US$ 0,3400 may weaken the bullish scenario. Technical analysis does not guarantee results.
CARLOS BORGES FINANCIAL ANALYST BINANCE