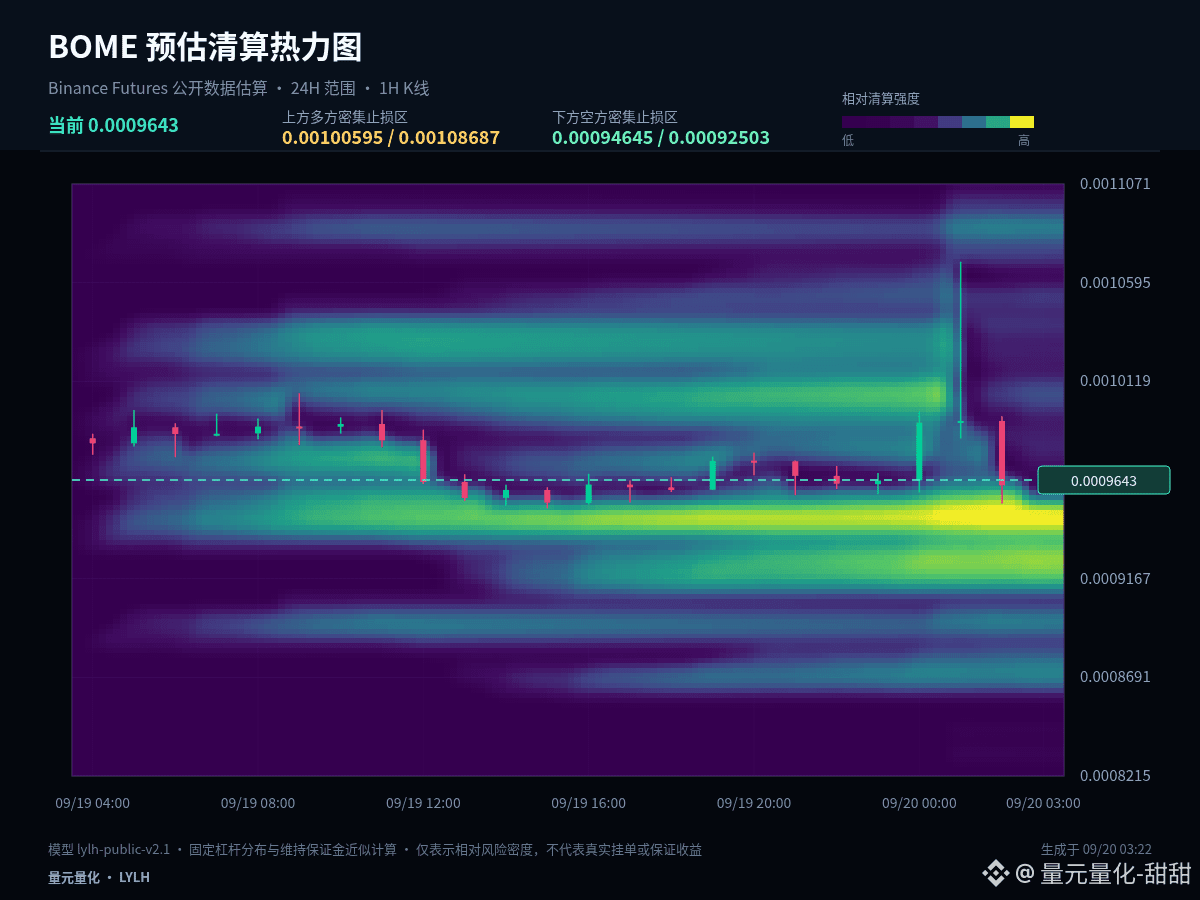
$BOME #BOME Drawdowns in a strong market often reveal the real order flow more clearly than a sudden acceleration and surge. Currently, the 1-hour change is +0.33%, and the 24-hour change is -2.73%. We need to judge whether this is normal cooling off or a structural weakening.
The current price is close to the lower bound of the past 24 hours’ range. With the 1-hour at +0.33% and the 24-hour at -2.73%, the key in analyzing the lower zone is not to bottom-fish early, but to observe whether price can quickly reclaim after a breakdown. If it can reclaim, it means selling pressure is being absorbed; if it keeps lingering below the lower bound, it indicates the weakness is not over.
In the short term, the initiative has not been clearly broken. 0.0010111 is the primary standard for the quality of a pullback. Hold it, then test 0.00107 again—that would indicate a relatively strong consolidation. If it breaks below the midline and stays there, then the observation focus should be shifted down to 0.0009522.
My outlook is not a single-direction bet. If the price breaks above 0.00107 and can maintain it, it suggests upside space has been reopened. If it breaks below 0.0009522 and fails to reclaim on a bounce, it means the structure has weakened further. If it trades between the two levels, continue monitoring the closing behavior on both sides of 0.0010111.
Position sizing needs to distinguish between spot and contracts. For existing spot holdings, manage in segments around key levels without frequently flipping bias based on a single 1-hour candlestick. For those with no position, wait for confirmation and then scale in more calmly. Contracts place more emphasis on entry location and invalidation conditions. When volatility expands, proactively reduce position size to avoid turning short-term judgment into passive holding.
For contracts, the focus is not to predict every single candlestick, but to ensure that entries, reductions, and exits all have a clear rationale. If there is no confirmation, do less. If a key level fails, redo the plan—control single-trade risk first, and only then discuss potential upside space.
#BTCBreaks80K
The current price is close to the lower bound of the past 24 hours’ range. With the 1-hour at +0.33% and the 24-hour at -2.73%, the key in analyzing the lower zone is not to bottom-fish early, but to observe whether price can quickly reclaim after a breakdown. If it can reclaim, it means selling pressure is being absorbed; if it keeps lingering below the lower bound, it indicates the weakness is not over.
In the short term, the initiative has not been clearly broken. 0.0010111 is the primary standard for the quality of a pullback. Hold it, then test 0.00107 again—that would indicate a relatively strong consolidation. If it breaks below the midline and stays there, then the observation focus should be shifted down to 0.0009522.
My outlook is not a single-direction bet. If the price breaks above 0.00107 and can maintain it, it suggests upside space has been reopened. If it breaks below 0.0009522 and fails to reclaim on a bounce, it means the structure has weakened further. If it trades between the two levels, continue monitoring the closing behavior on both sides of 0.0010111.
Position sizing needs to distinguish between spot and contracts. For existing spot holdings, manage in segments around key levels without frequently flipping bias based on a single 1-hour candlestick. For those with no position, wait for confirmation and then scale in more calmly. Contracts place more emphasis on entry location and invalidation conditions. When volatility expands, proactively reduce position size to avoid turning short-term judgment into passive holding.
For contracts, the focus is not to predict every single candlestick, but to ensure that entries, reductions, and exits all have a clear rationale. If there is no confirmation, do less. If a key level fails, redo the plan—control single-trade risk first, and only then discuss potential upside space.
#BTCBreaks80K