$BTC 【This Bitcoin cycle is likely to break through the previous high 82,850 in one move, then push toward 87,000–90,000. For the next move, see the analysis below】
In this rally, Huang Ge also perfectly signaled and successfully bought the bottom right after the rate hike—like always, he’s got the broader market under control.
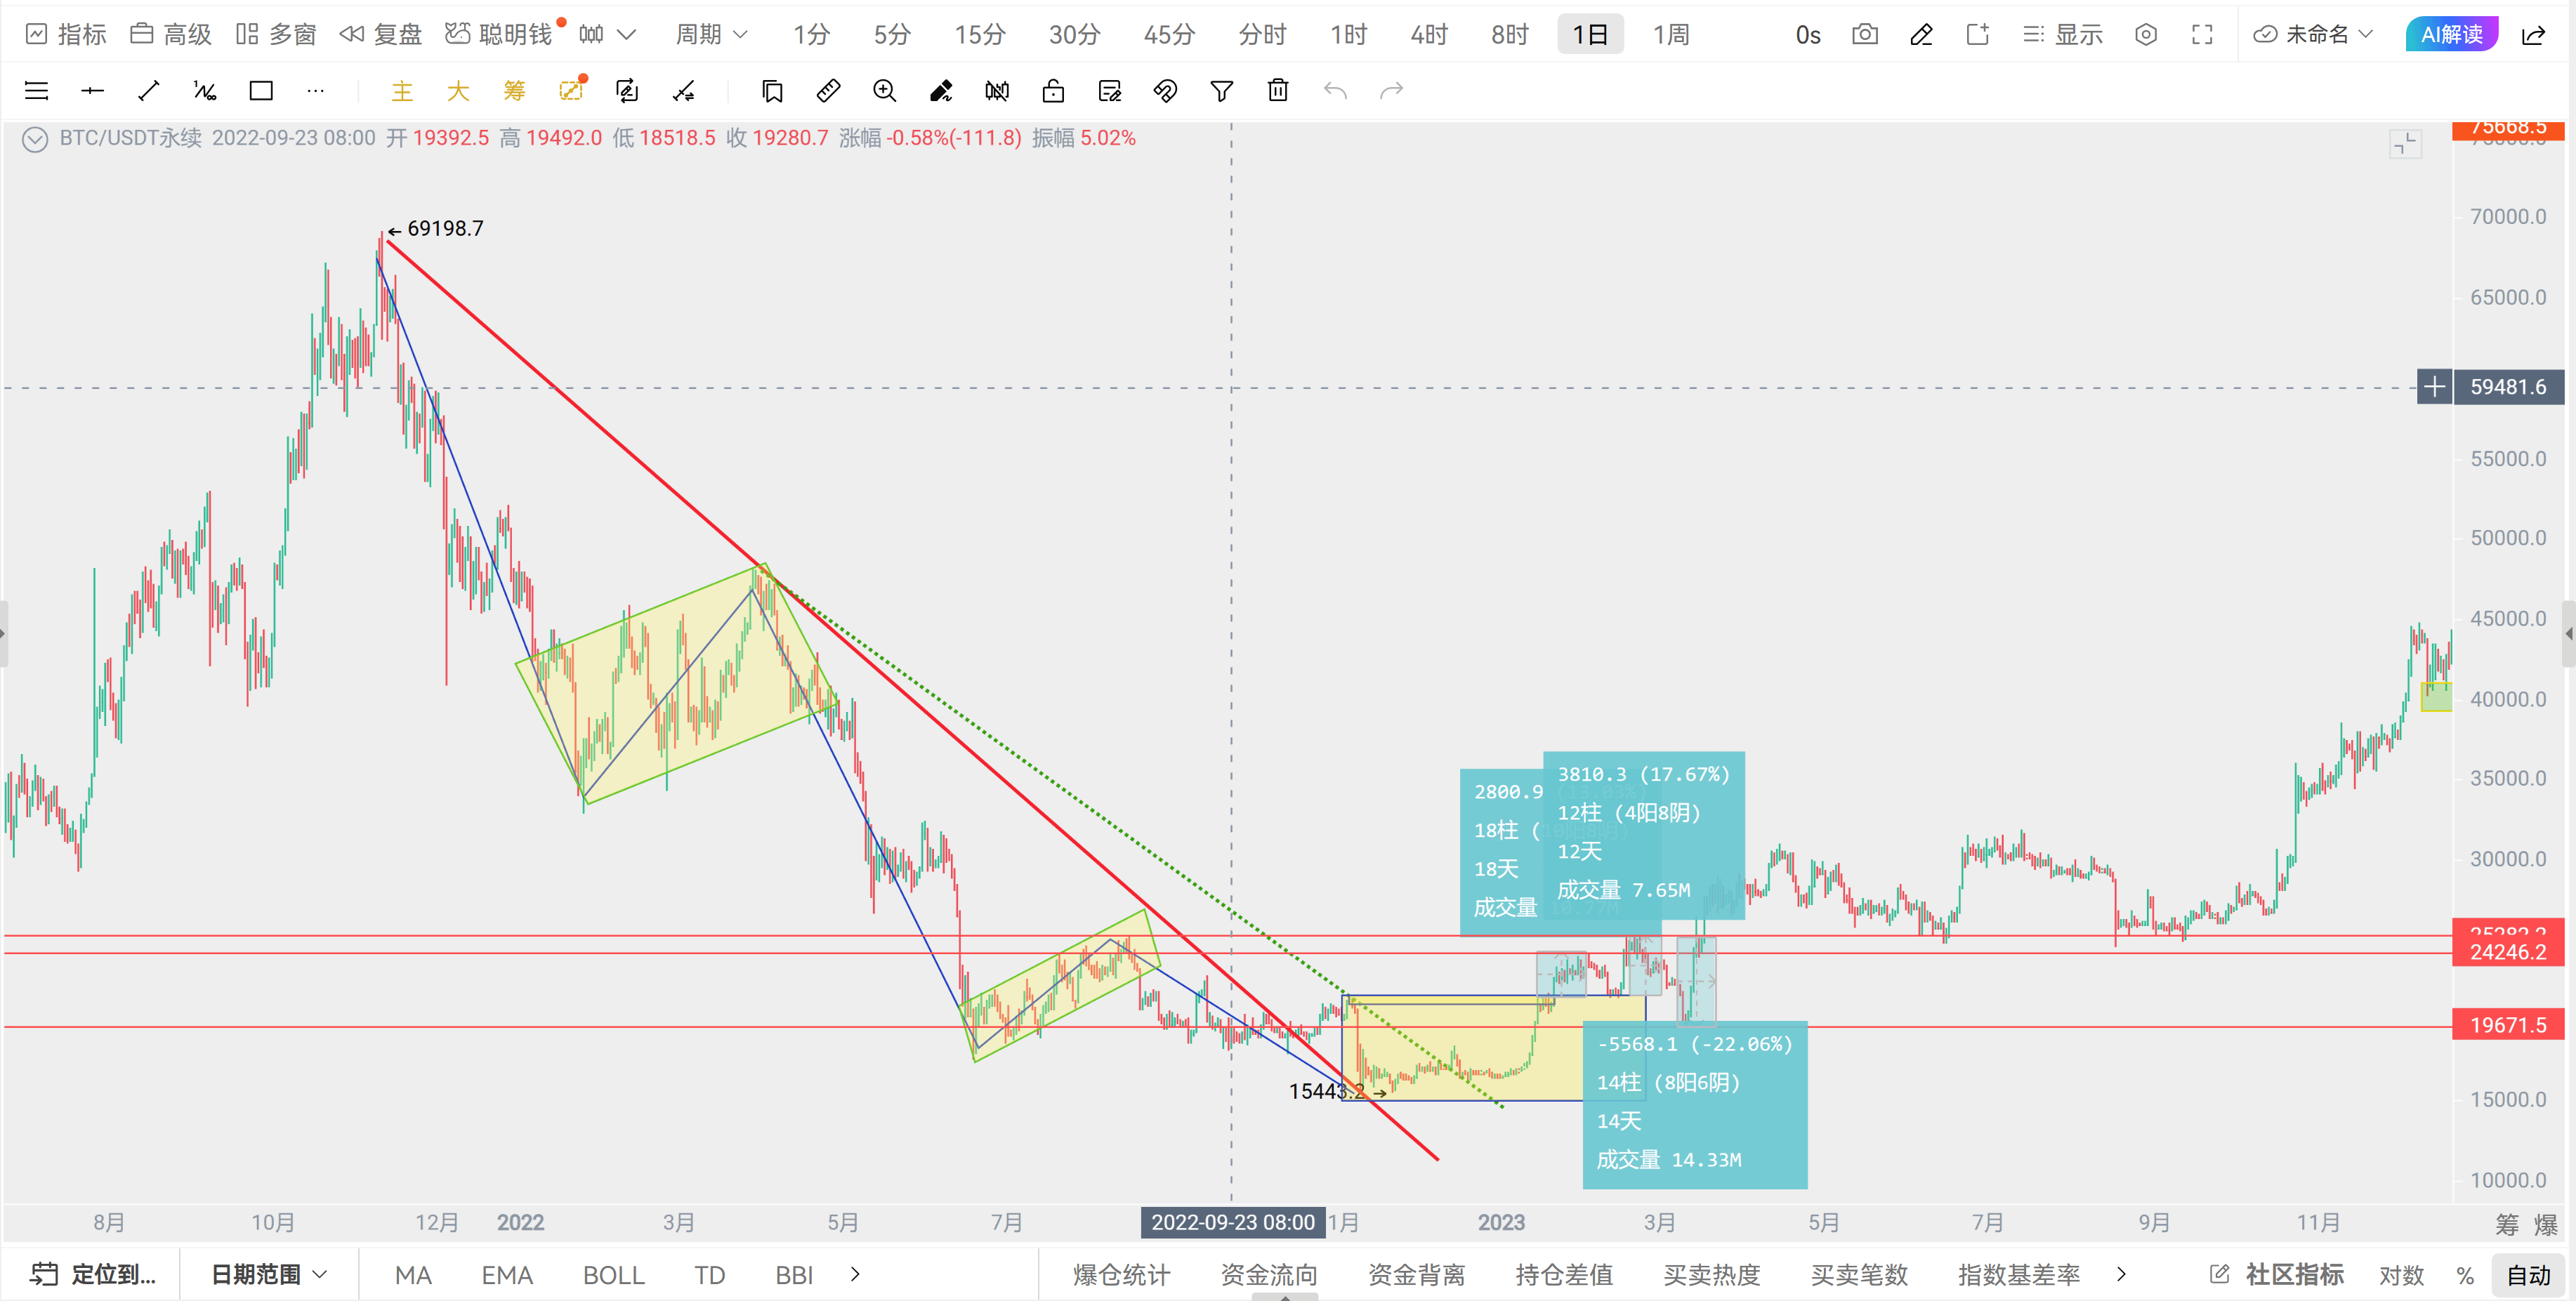
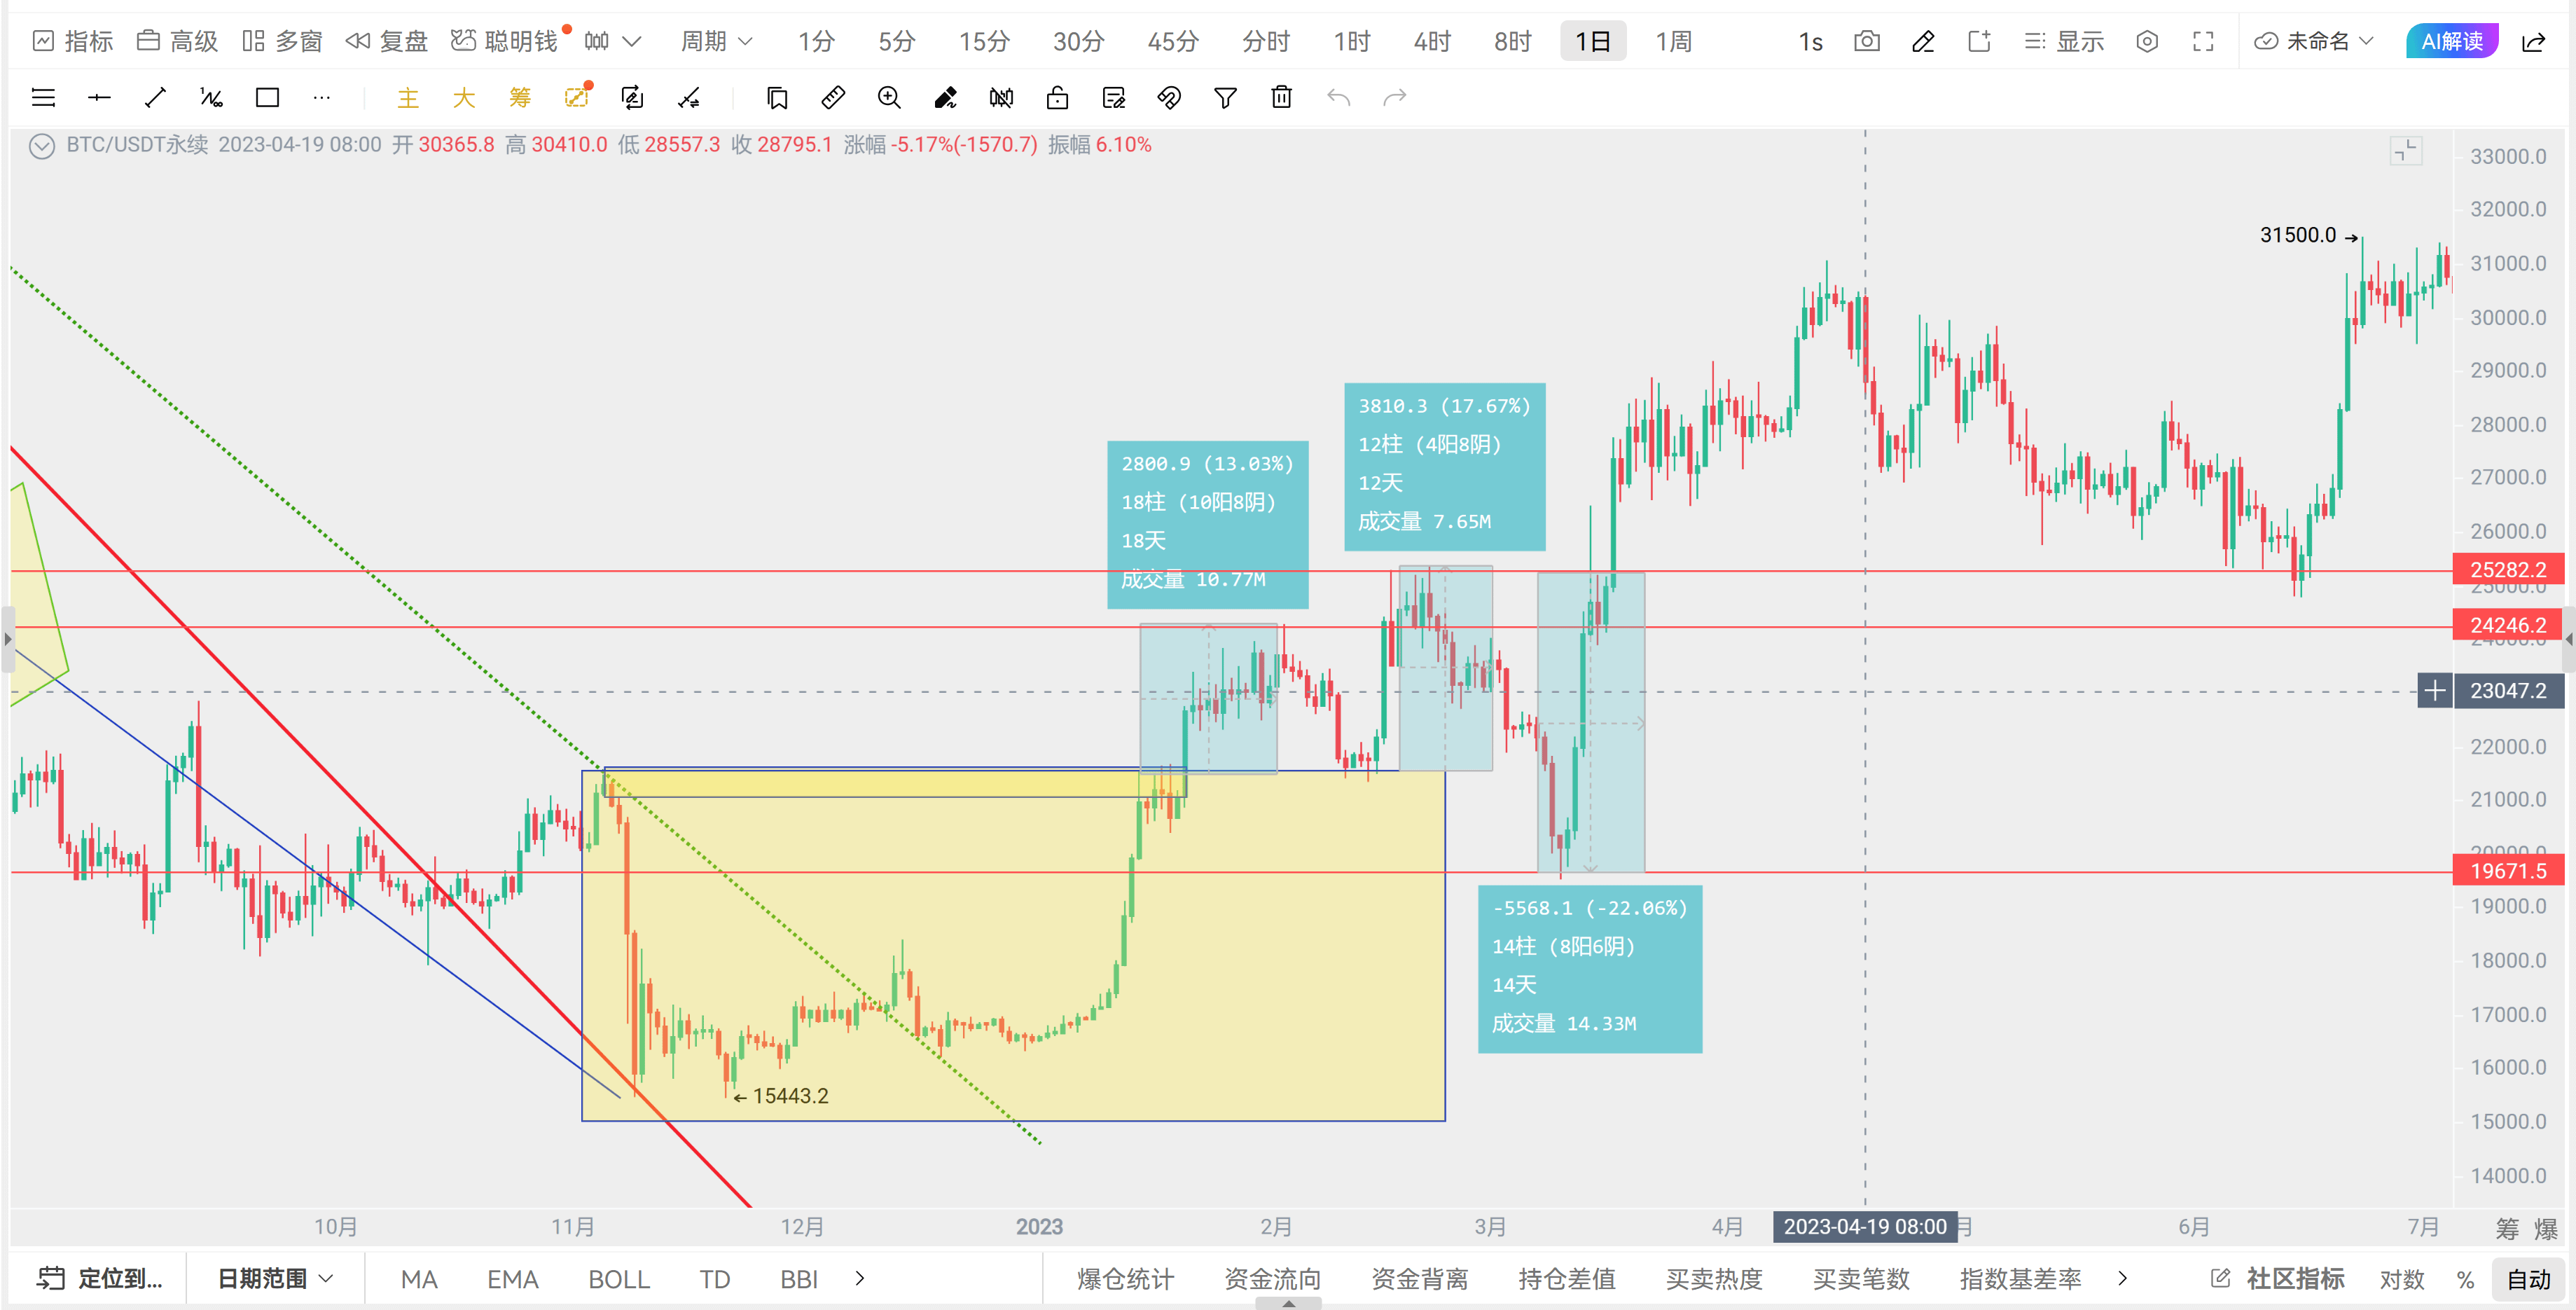
Now let’s look at the current situation. Charts 1 and 2 show the bottoms of the previous bear and bull cycles. You can see that the bear-market structure also followed a five-wave decline. Then a bottom parallel range formed and built a base. Huang Ge, back in last November—when BTC was around 100,000—started to judge that the bear market was coming. He kept reminding everyone to expect a five-wave decline and kept shorting. If you look through all his earlier posts, you can find plenty of evidence.
In the previous cycle, you can see: price dropped to the 15,000+ bottom, then returned to the upper boundary of the parallel range, traded sideways for a while, then broke through the previous high around 21,500. After that, it rose another 13%, then pulled back, rose again by 17%, followed by a huge correction of 22%, and then continued to climb, gradually lifting the highs up to 126,000.
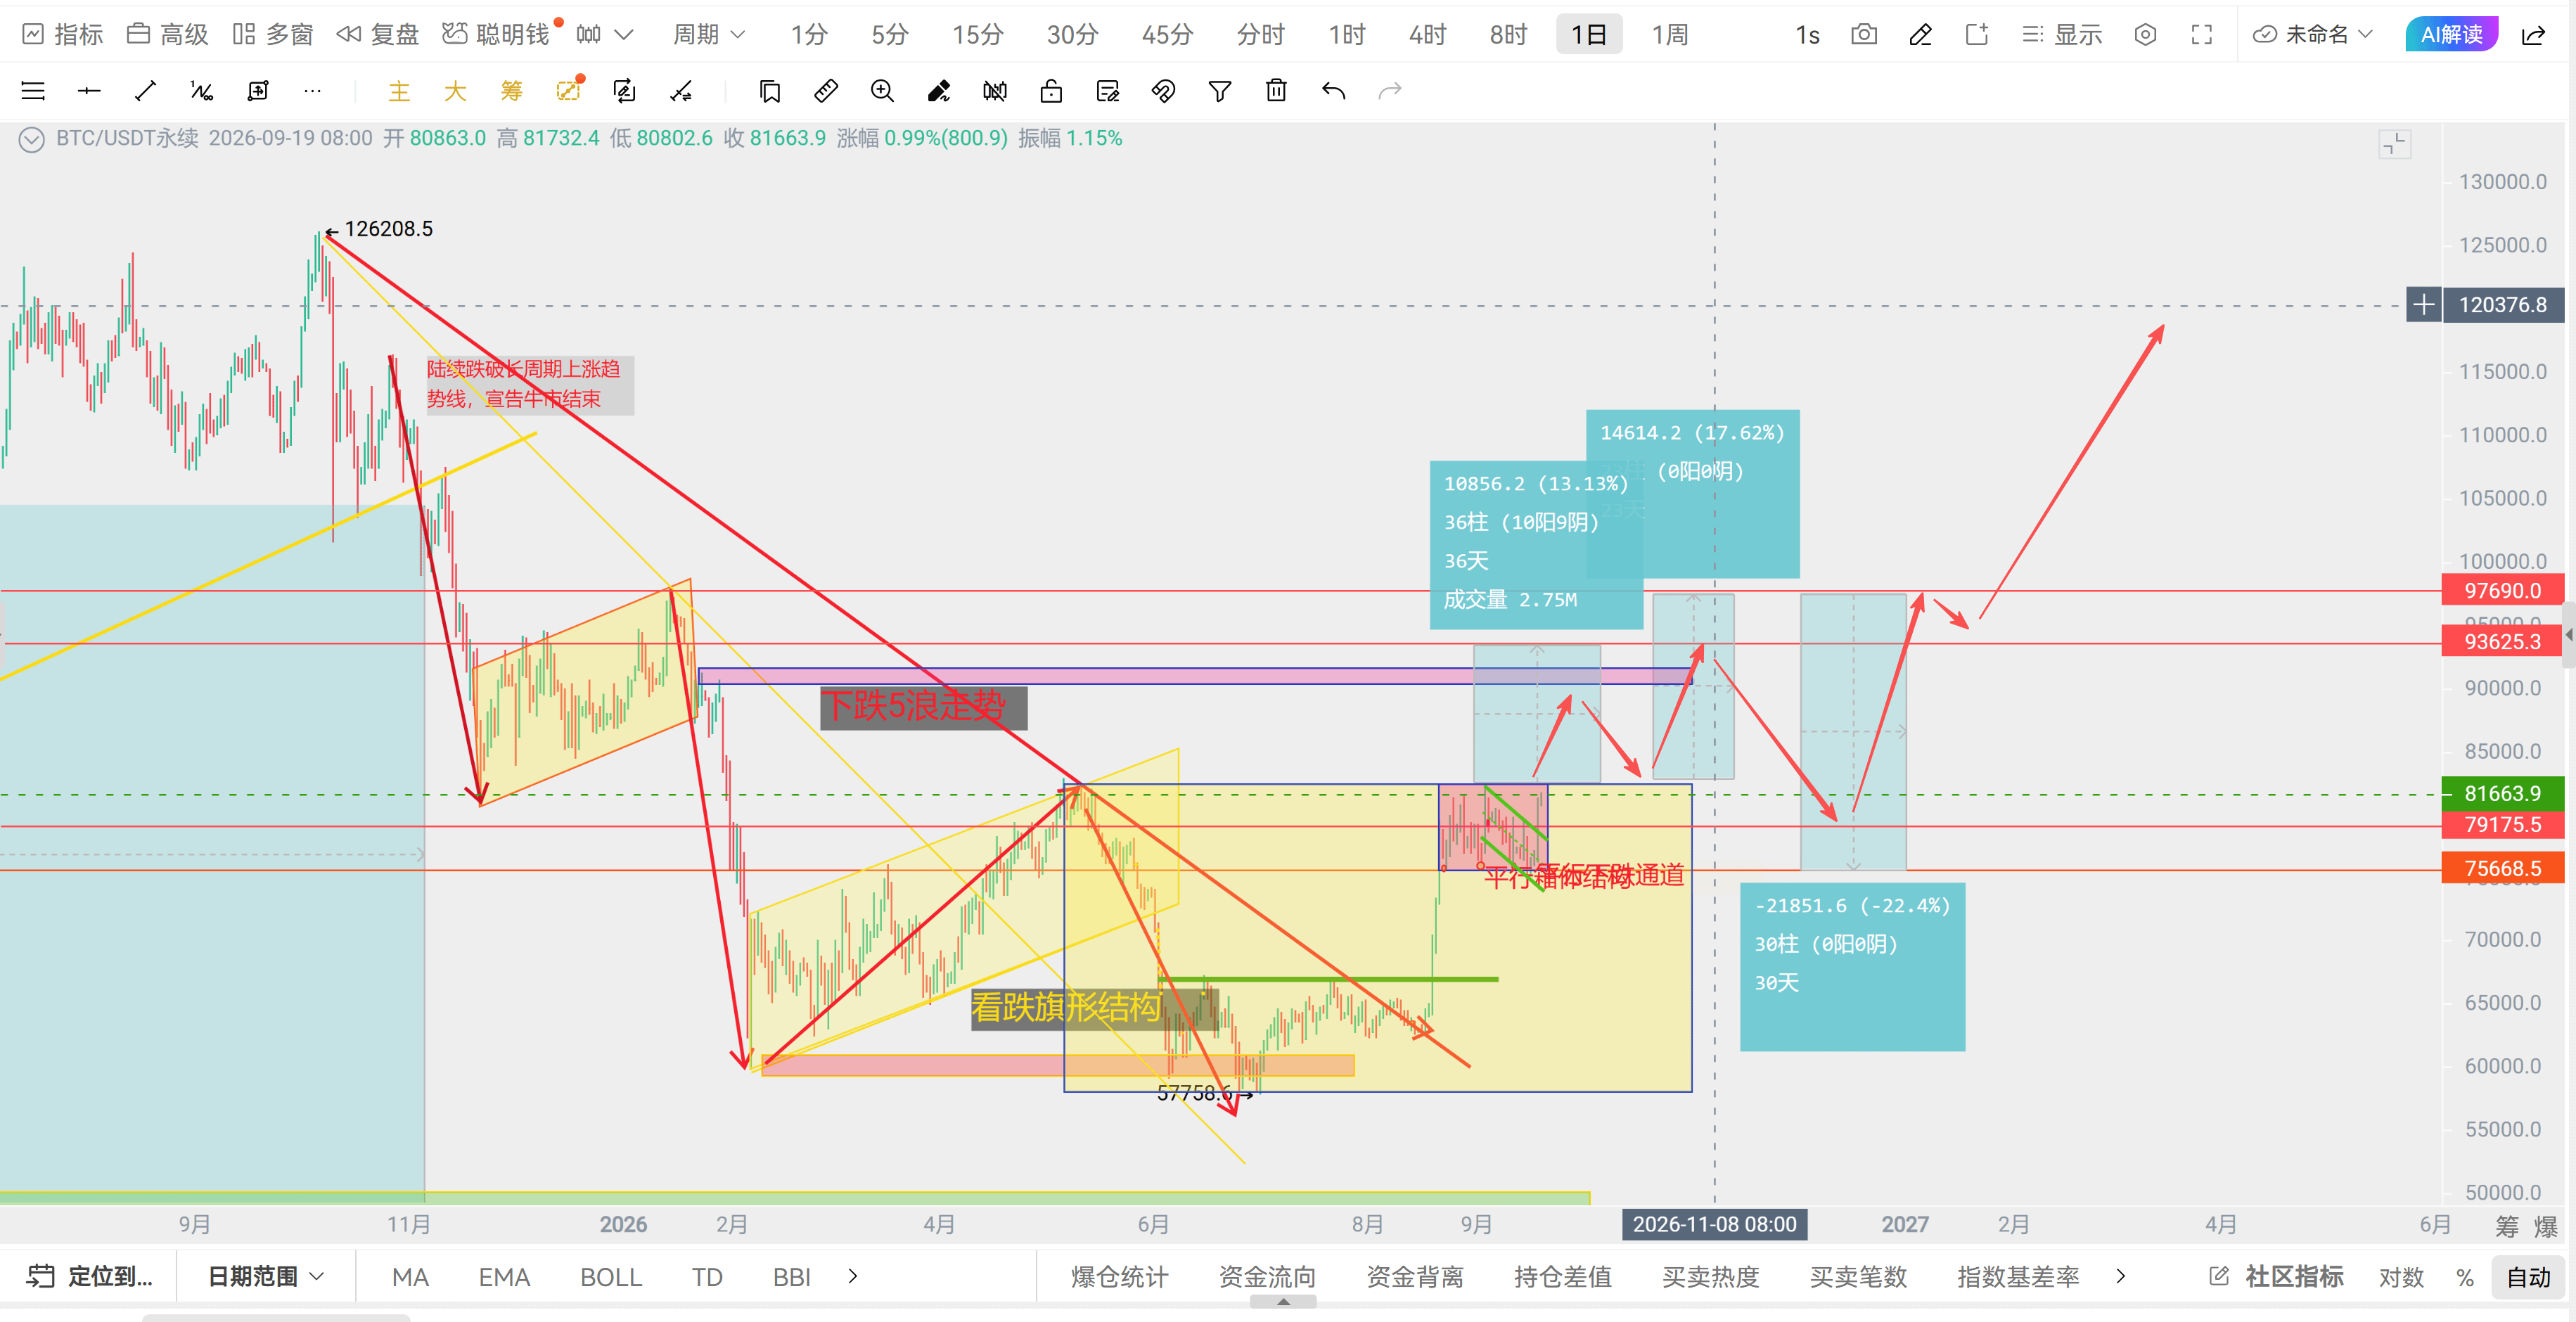
Comparing to this cycle’s Chart 3: you can see it’s also a five-wave decline, with a bottom that’s similar to a small W bottom, followed by a parallel range structure. Then the upper boundary of the range consolidates/oscillates. You could say the trading approach is very similar. So this time, it’s very possible it will break through the previous high 82,850. As reference from the prior cycle: it fell from about 69,000 to 15,000+. This cycle fell from 126,000 to 57,800. The bottom-percentage difference is significant. Then considering the flag pattern structure ahead as resistance, the next move might look roughly like this (marked on the chart): This wave is likely to reach 87,000–90,000, then pull back to around 82,850 near the upper boundary of the range, then move upward to reach 93,000–94,000. After that, there may be a big correction with a fake breakout above the upper boundary of the parallel range, dropping to around 79,000. Then it will “run wild” again—constantly lifting the highs—pushing toward 200,000 US dollars.
So everyone can use this route as a reference. This isn’t blindly copying the past—I think it’s a pretty reasonable bull-market trading path, with technical structure as the main basis.
Follow Huang Ge and read the market trend clearly.😉
$ETH $ZEC
In this rally, Huang Ge also perfectly signaled and successfully bought the bottom right after the rate hike—like always, he’s got the broader market under control.
Now let’s look at the current situation. Charts 1 and 2 show the bottoms of the previous bear and bull cycles. You can see that the bear-market structure also followed a five-wave decline. Then a bottom parallel range formed and built a base. Huang Ge, back in last November—when BTC was around 100,000—started to judge that the bear market was coming. He kept reminding everyone to expect a five-wave decline and kept shorting. If you look through all his earlier posts, you can find plenty of evidence.
In the previous cycle, you can see: price dropped to the 15,000+ bottom, then returned to the upper boundary of the parallel range, traded sideways for a while, then broke through the previous high around 21,500. After that, it rose another 13%, then pulled back, rose again by 17%, followed by a huge correction of 22%, and then continued to climb, gradually lifting the highs up to 126,000.
Comparing to this cycle’s Chart 3: you can see it’s also a five-wave decline, with a bottom that’s similar to a small W bottom, followed by a parallel range structure. Then the upper boundary of the range consolidates/oscillates. You could say the trading approach is very similar. So this time, it’s very possible it will break through the previous high 82,850. As reference from the prior cycle: it fell from about 69,000 to 15,000+. This cycle fell from 126,000 to 57,800. The bottom-percentage difference is significant. Then considering the flag pattern structure ahead as resistance, the next move might look roughly like this (marked on the chart): This wave is likely to reach 87,000–90,000, then pull back to around 82,850 near the upper boundary of the range, then move upward to reach 93,000–94,000. After that, there may be a big correction with a fake breakout above the upper boundary of the parallel range, dropping to around 79,000. Then it will “run wild” again—constantly lifting the highs—pushing toward 200,000 US dollars.
So everyone can use this route as a reference. This isn’t blindly copying the past—I think it’s a pretty reasonable bull-market trading path, with technical structure as the main basis.
Follow Huang Ge and read the market trend clearly.😉
$ETH $ZEC