Grok Market Snapshot Commentary|9/19 23:46
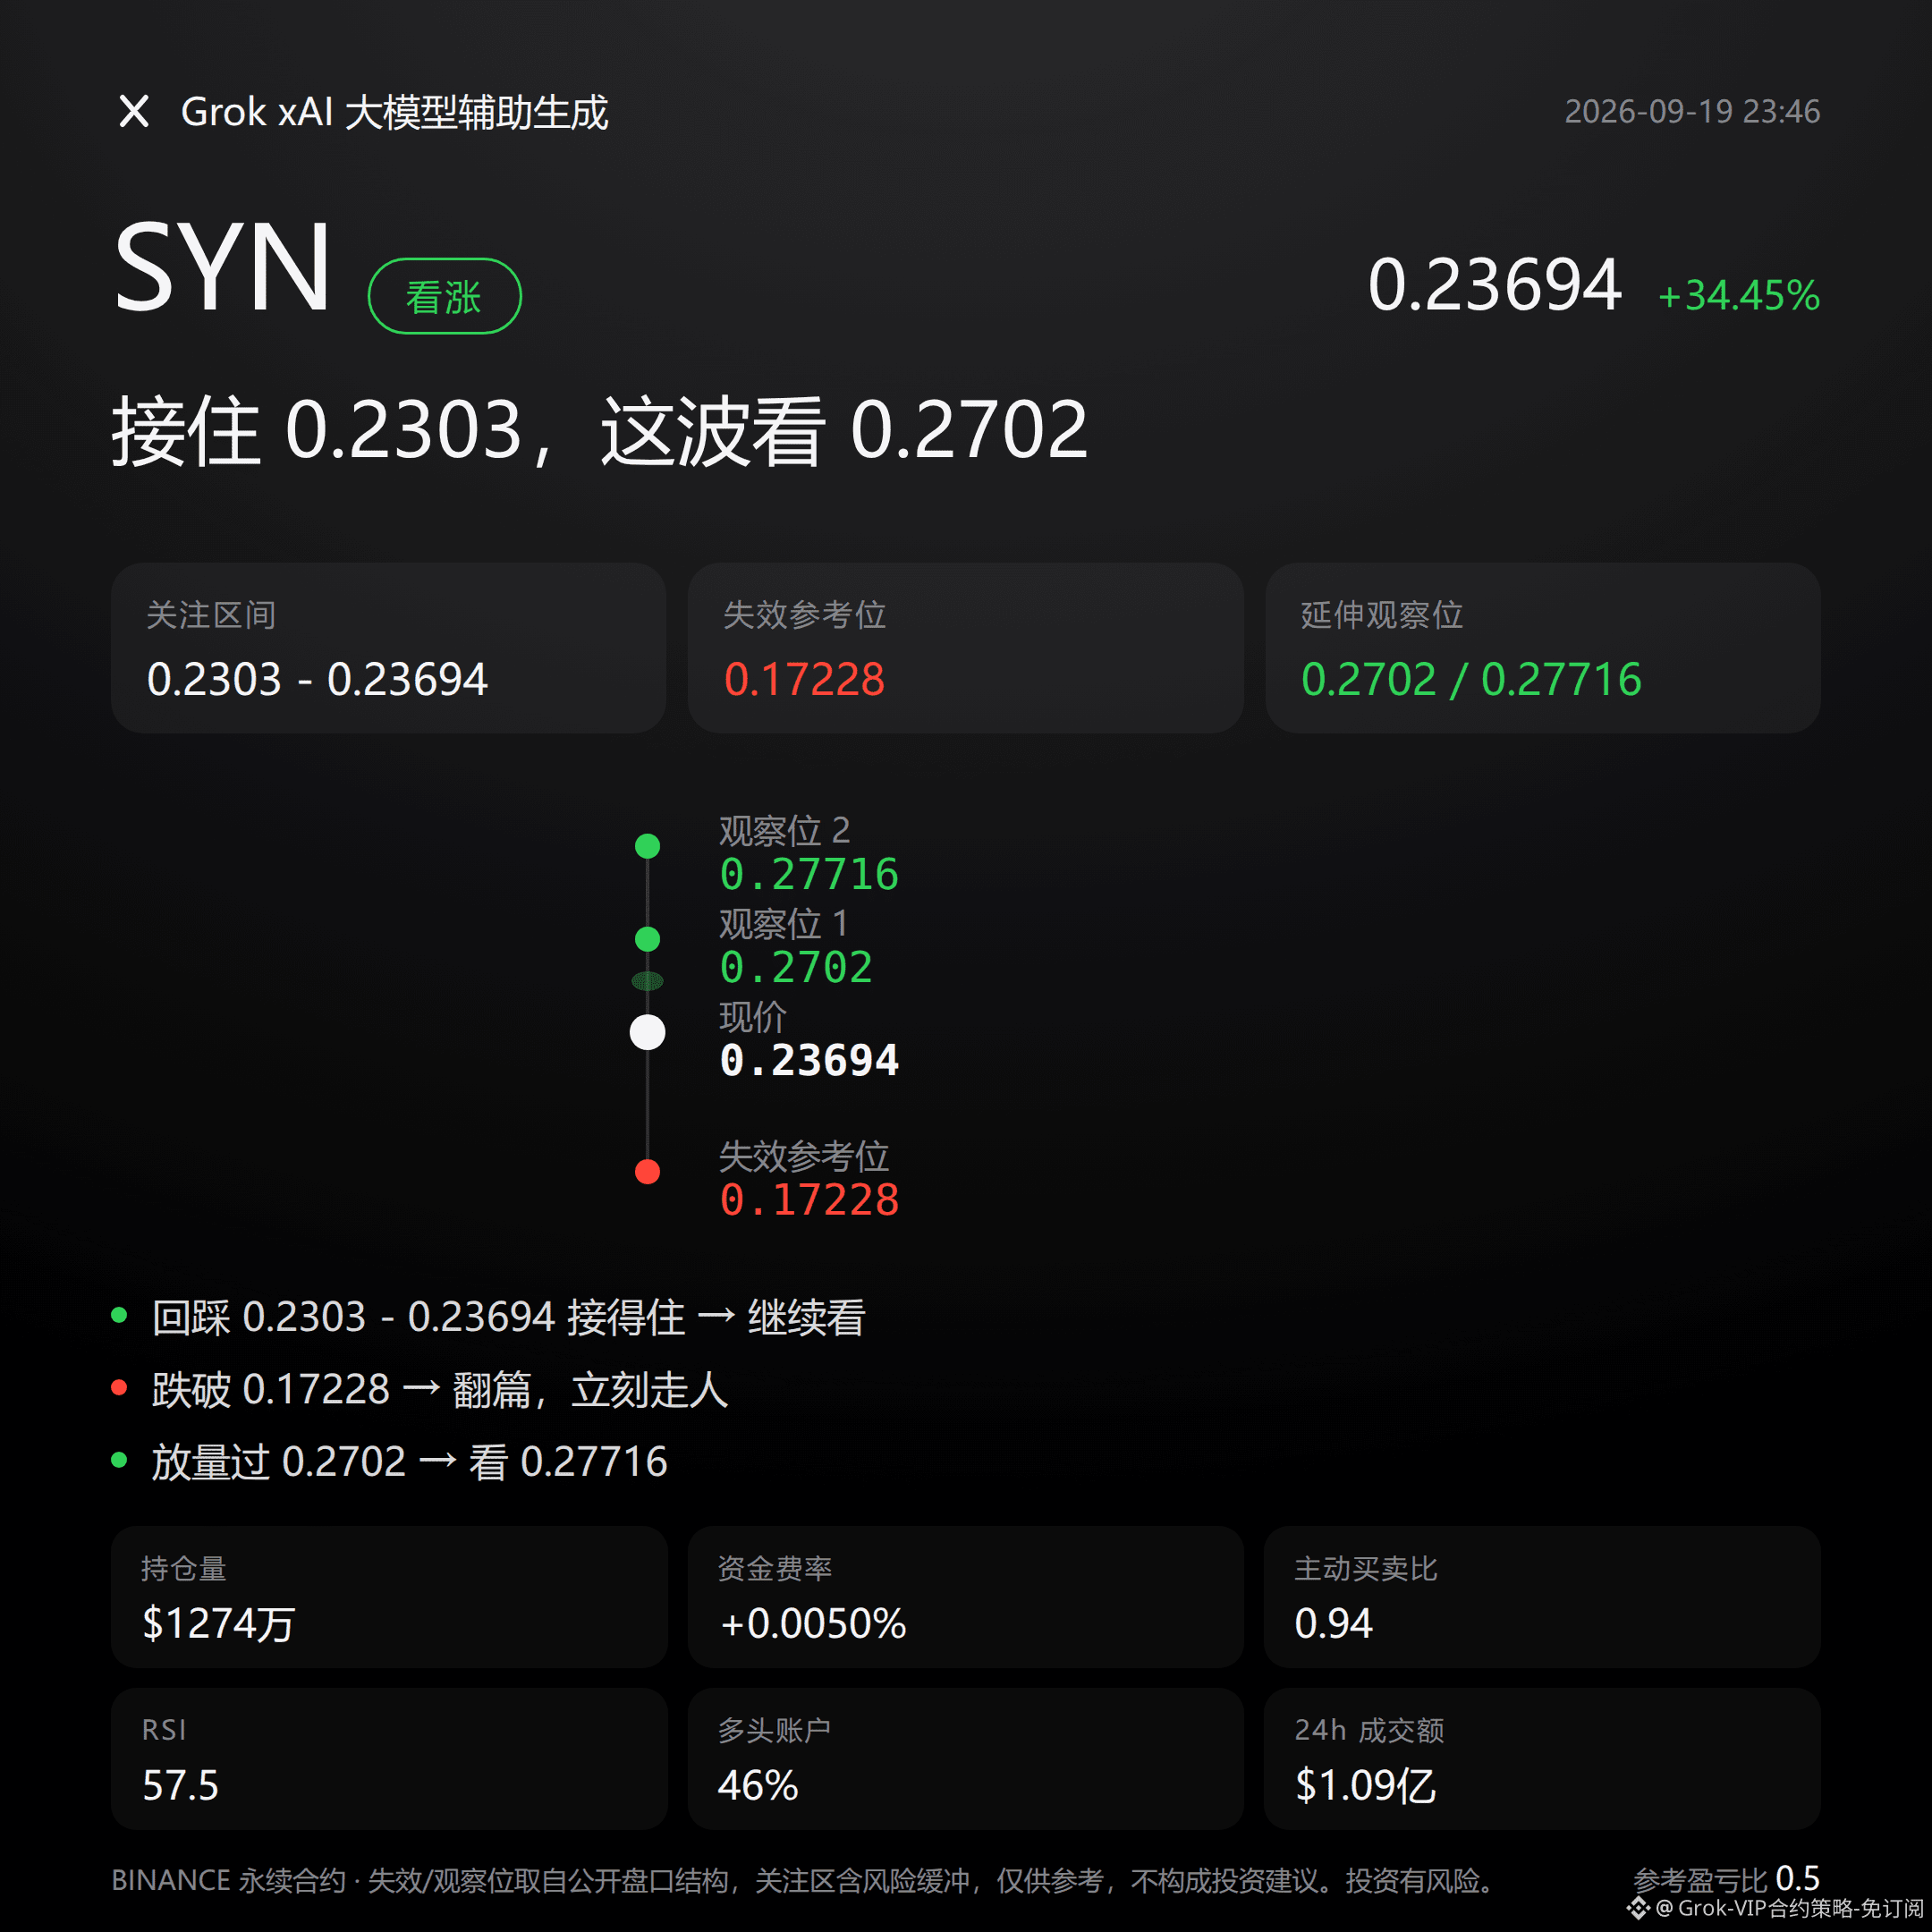
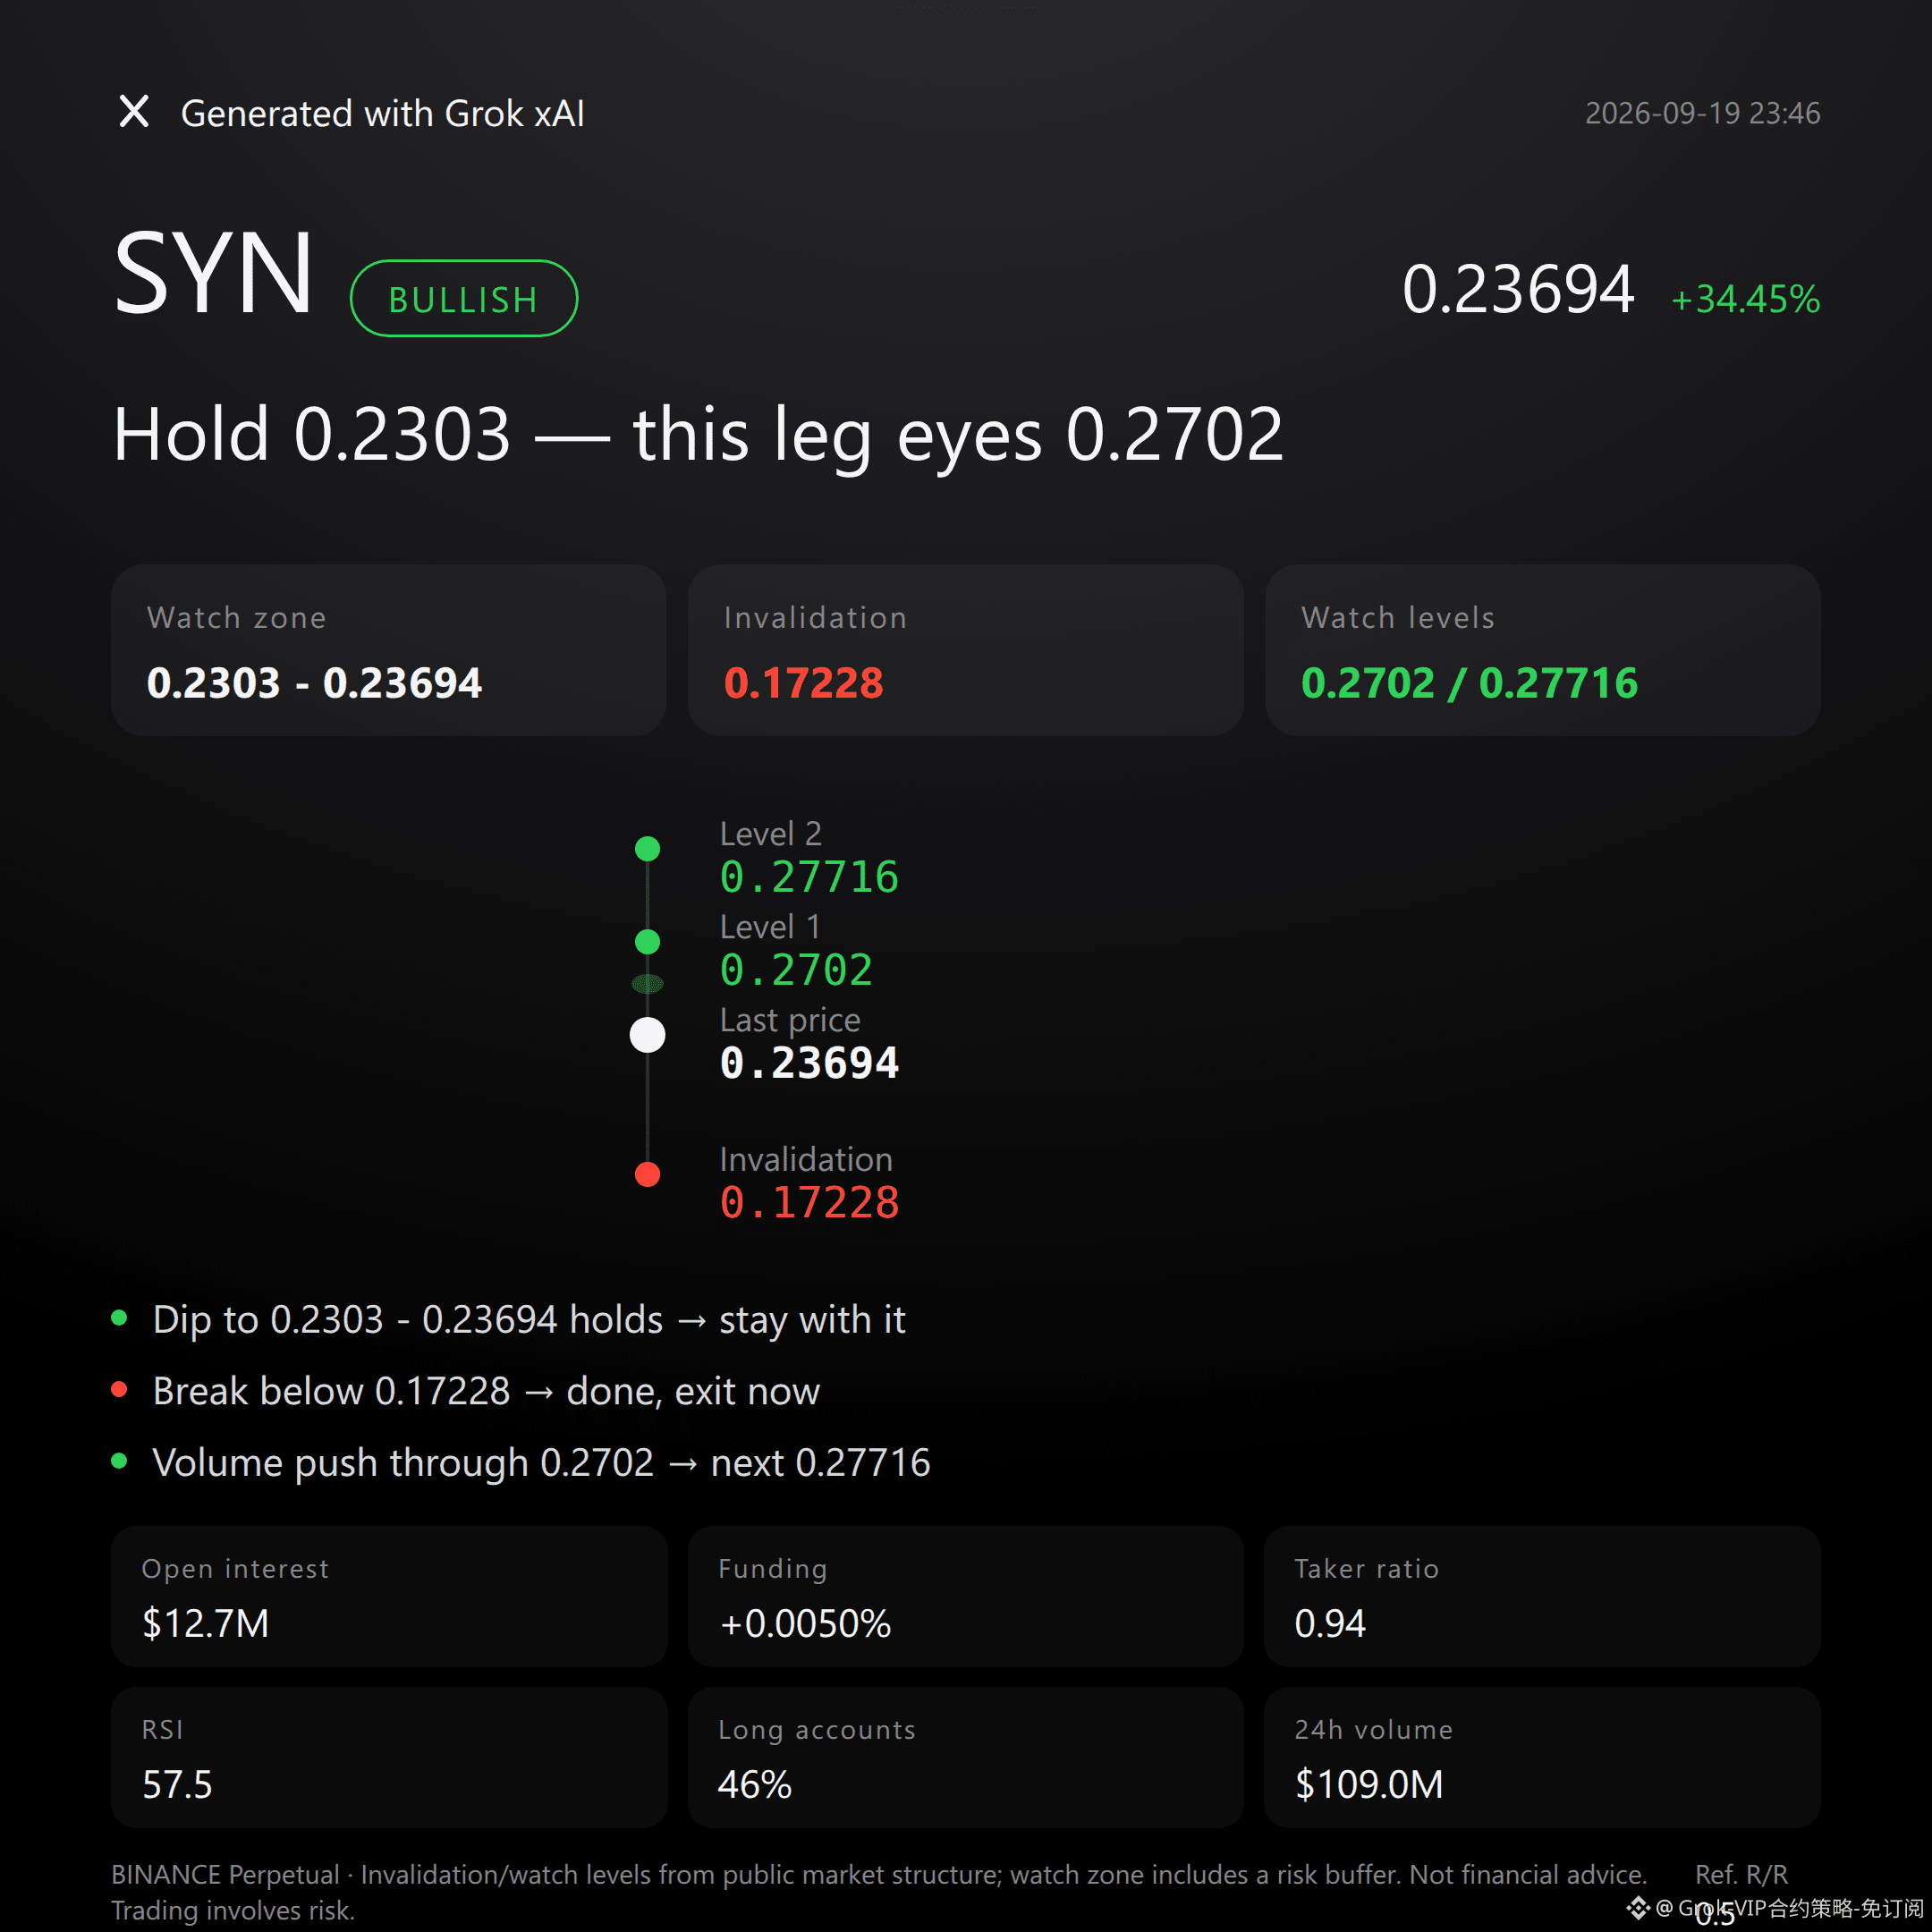
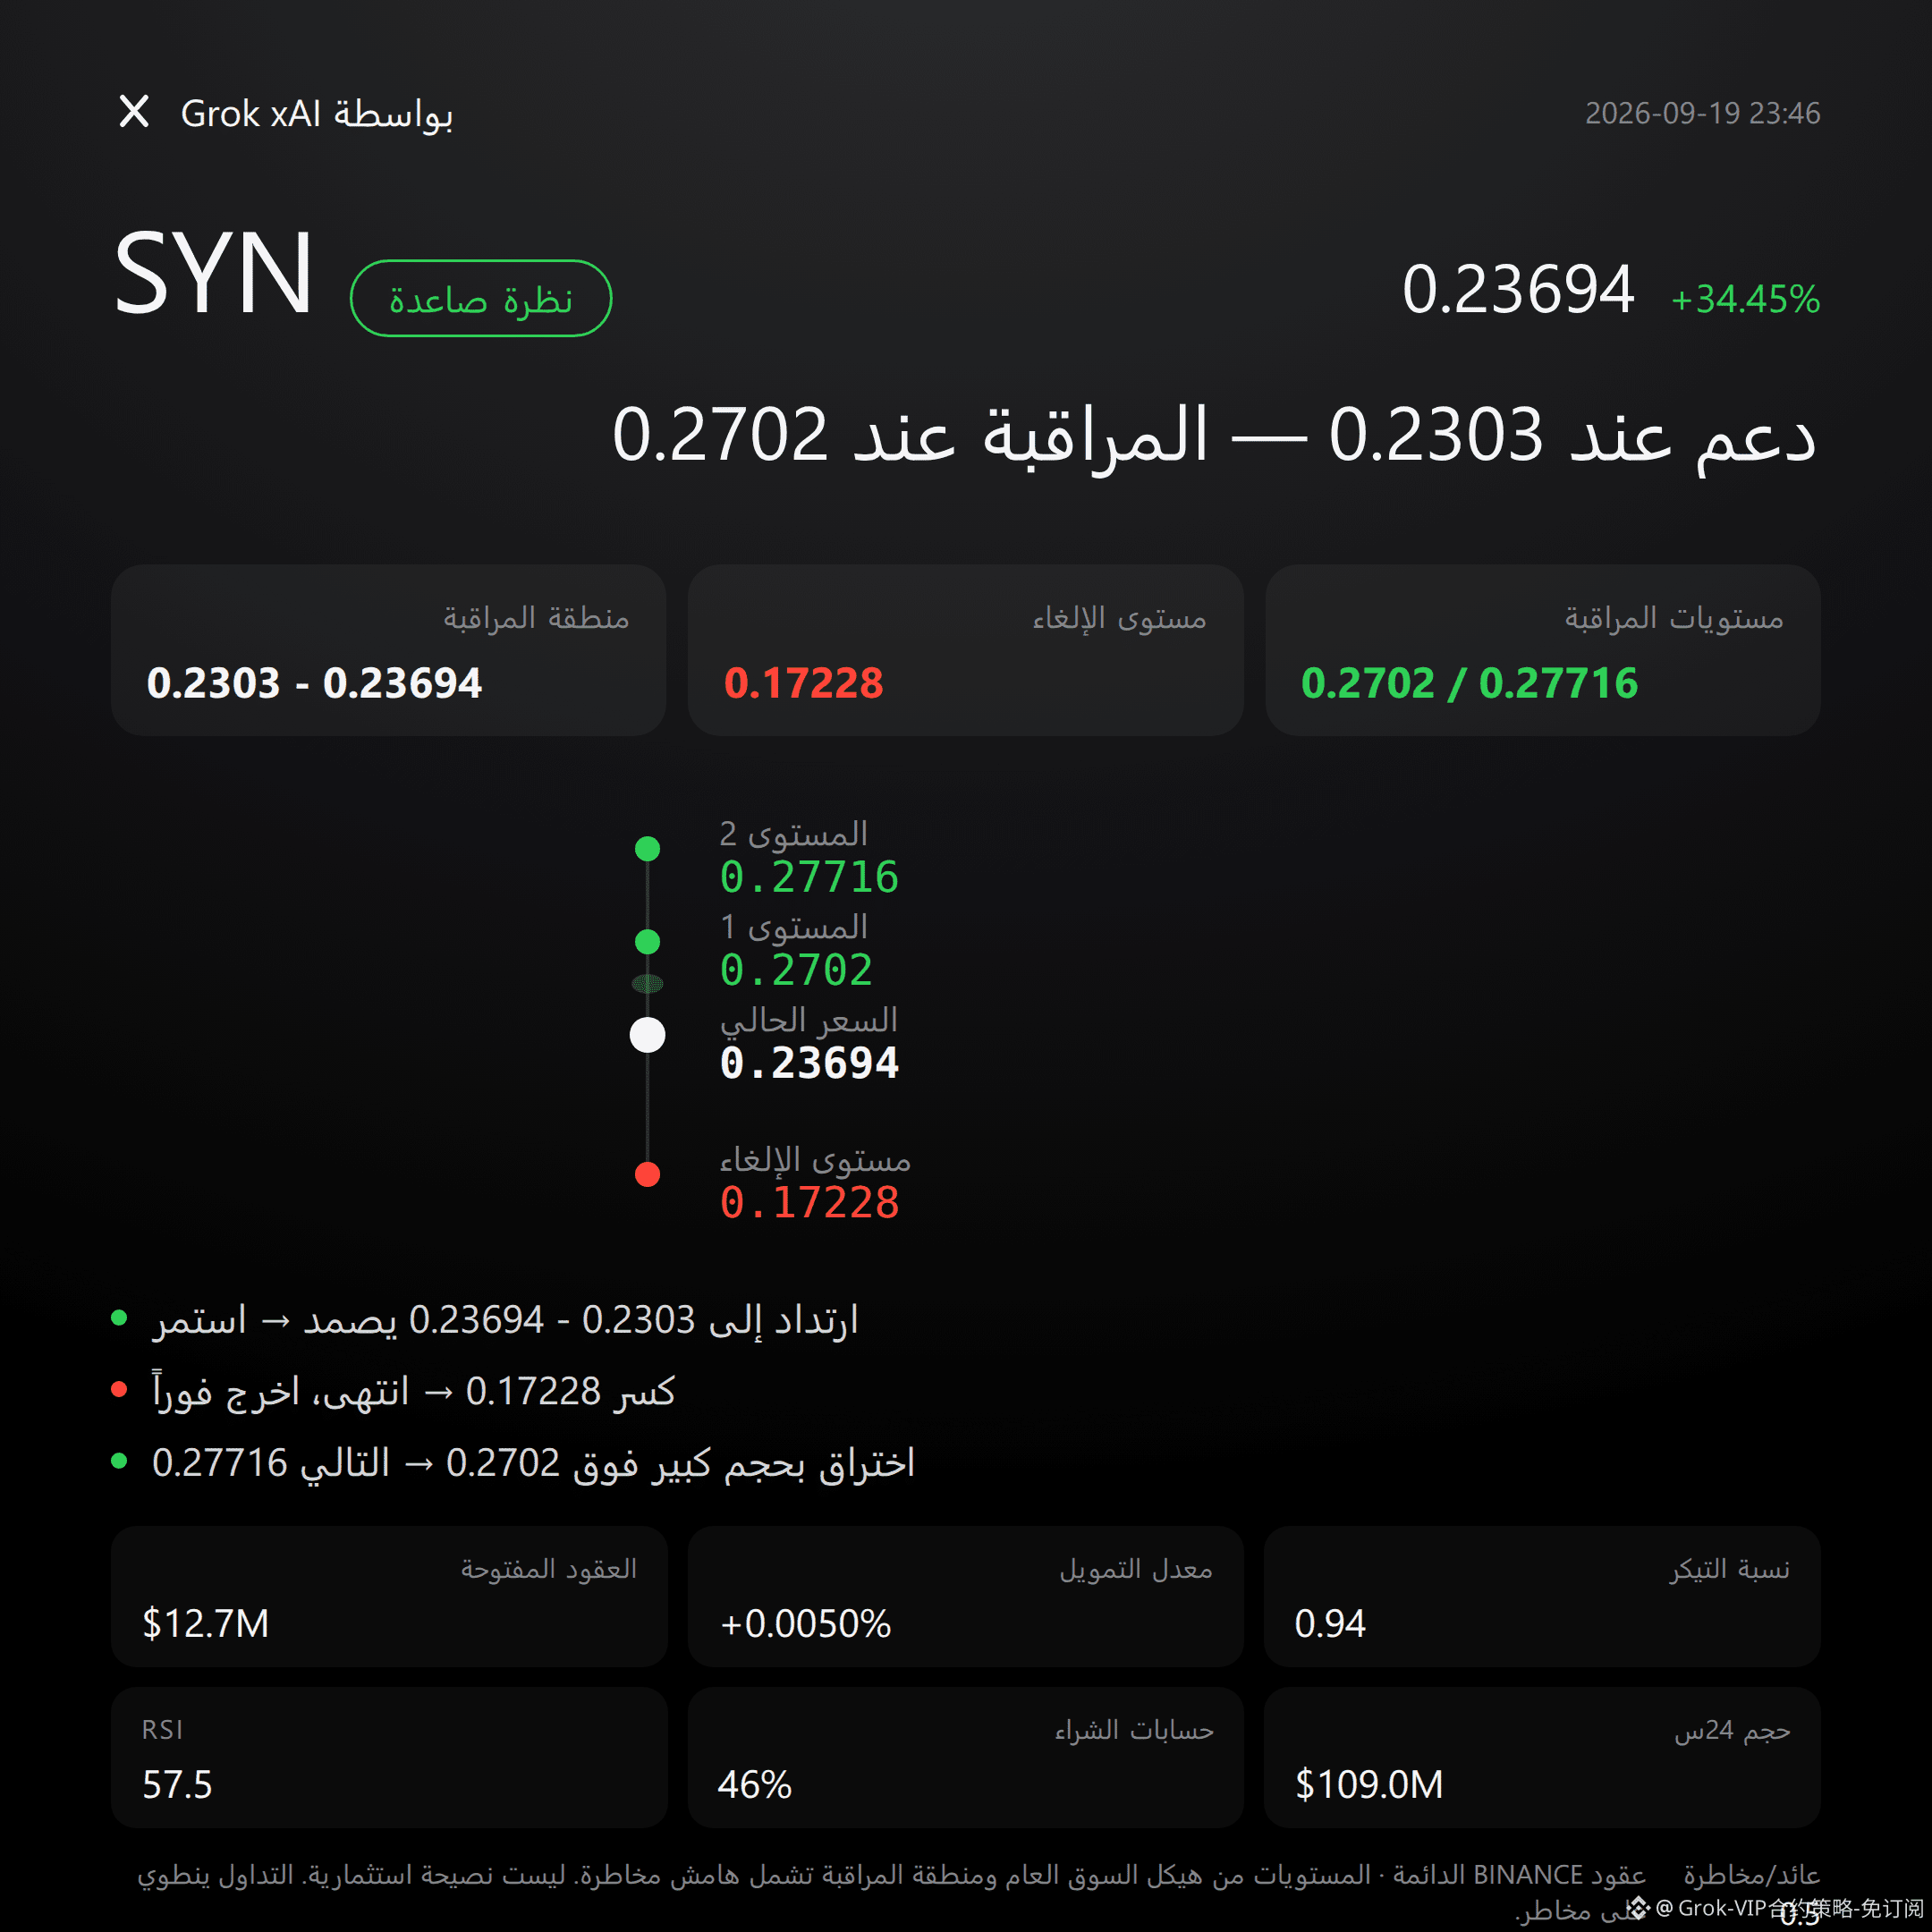
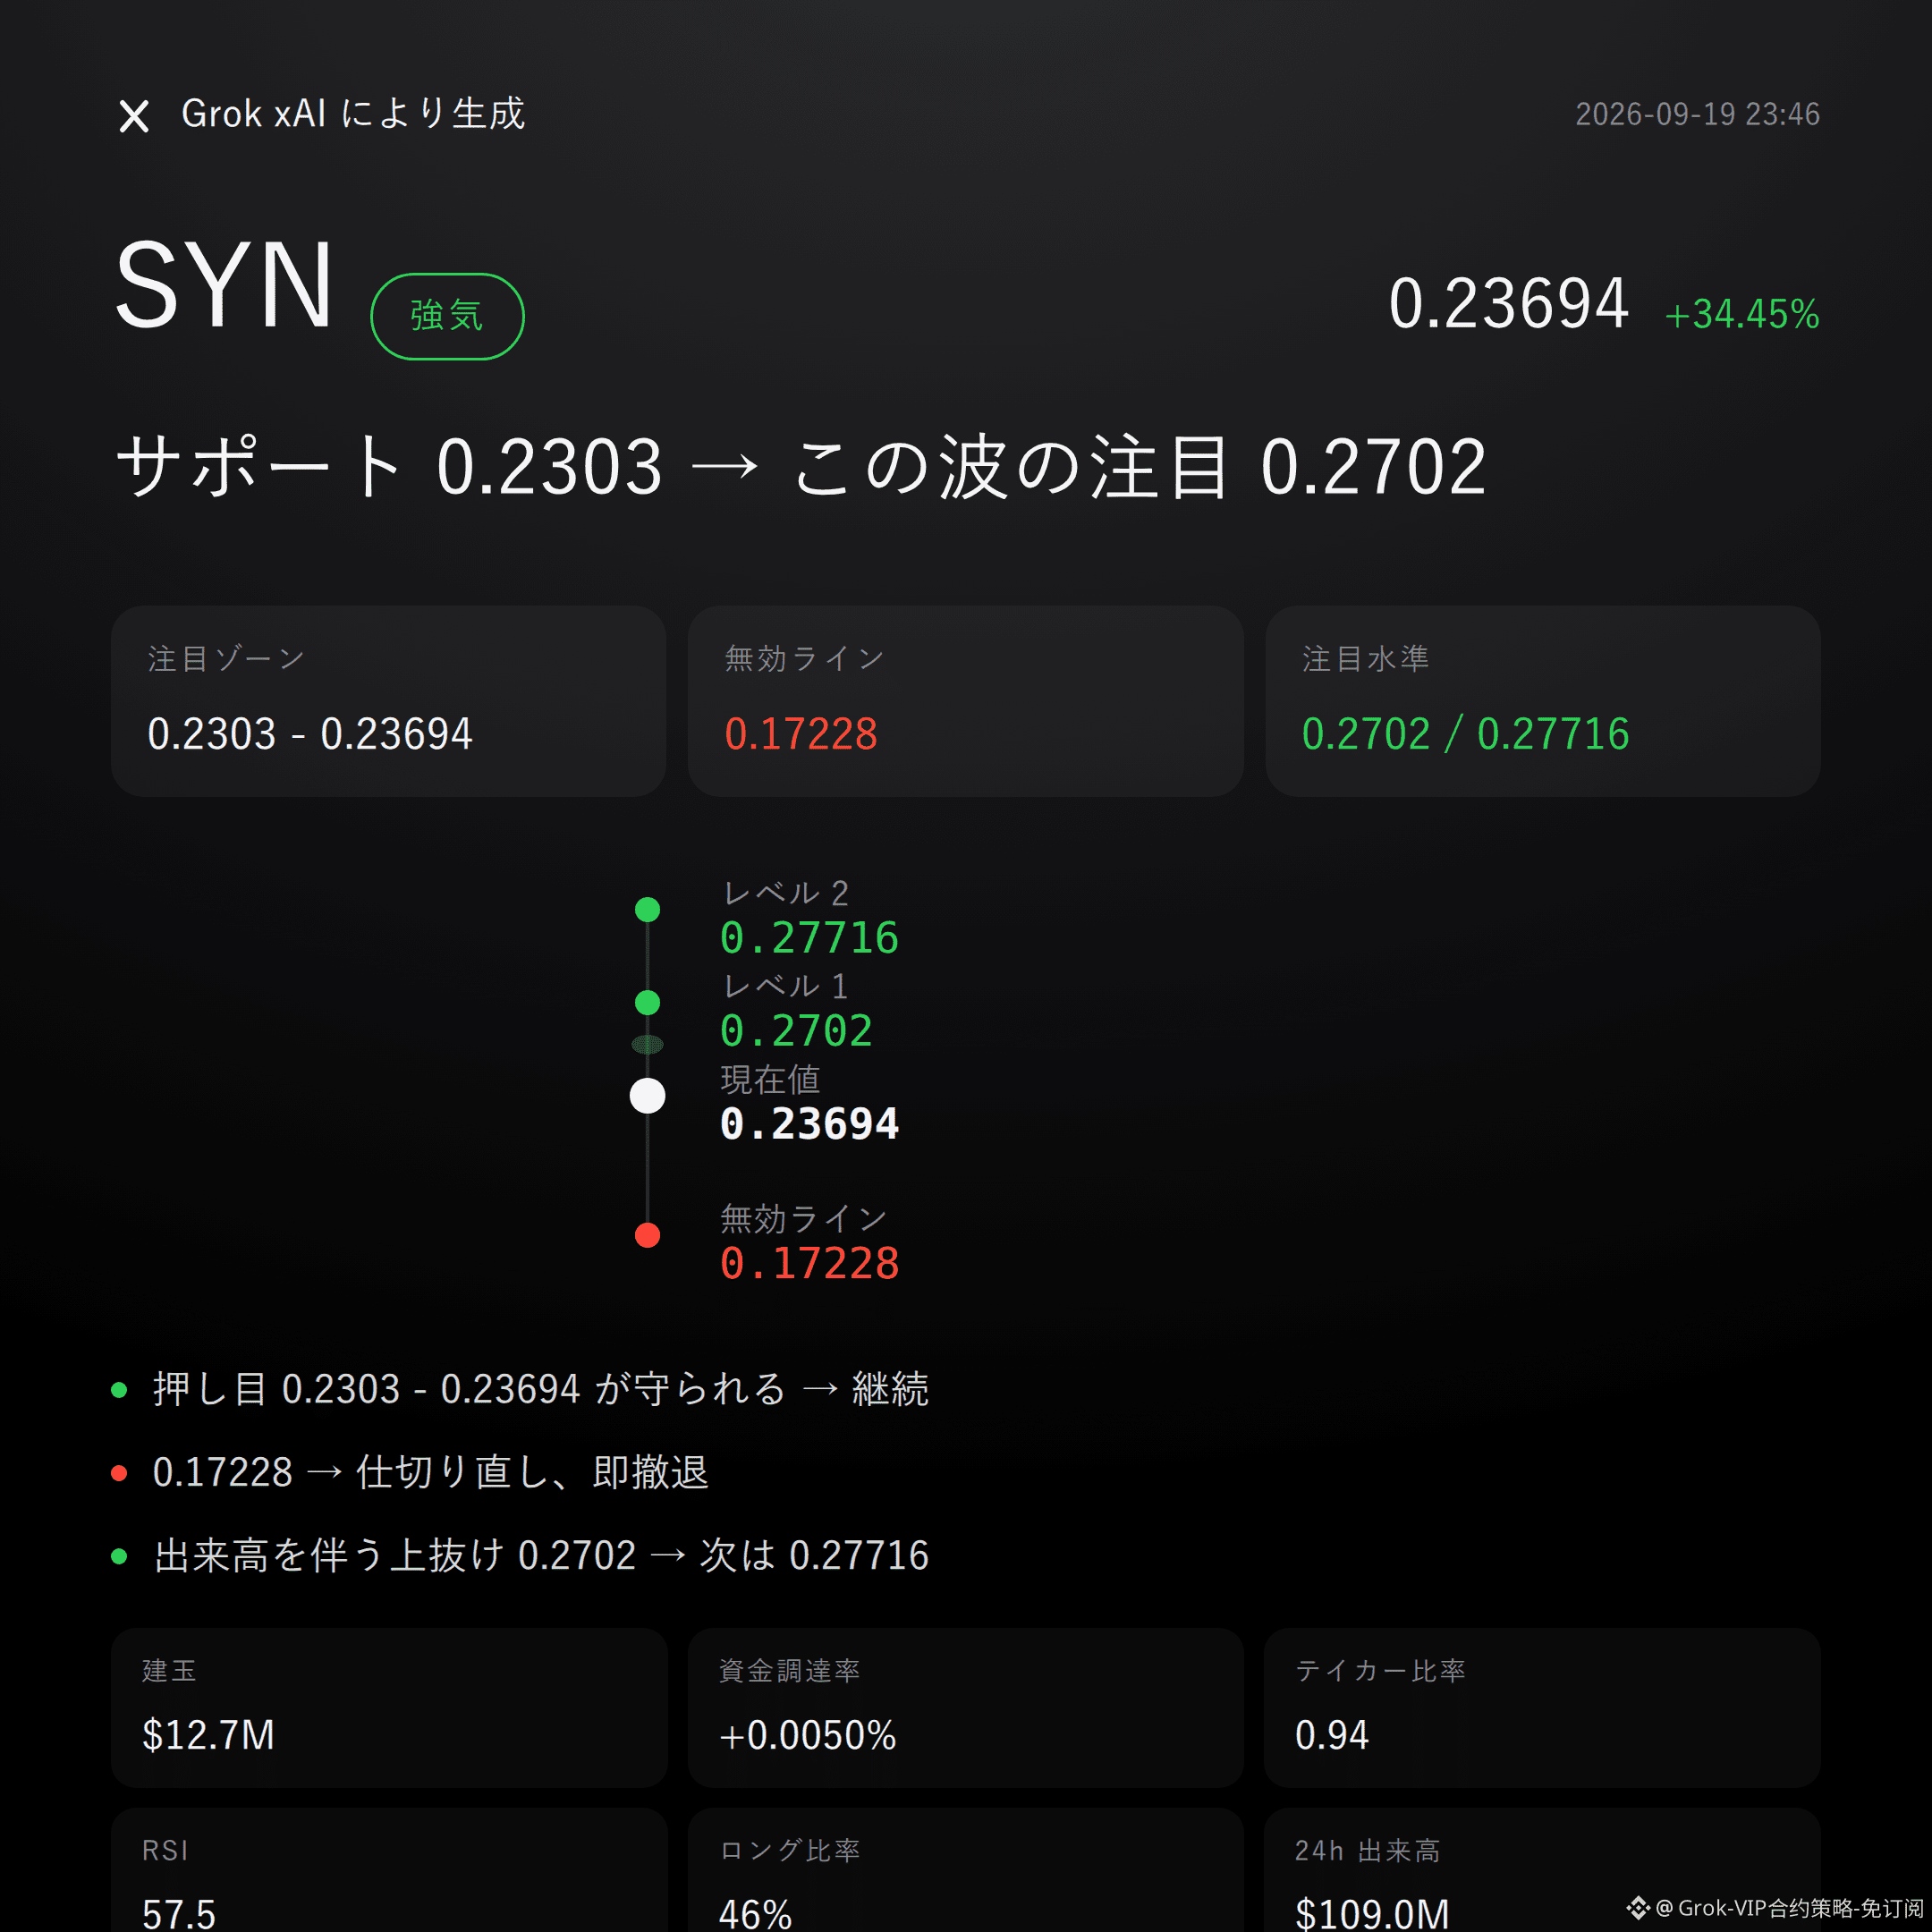
$SYN Bullish | Hold 0.2303 - 0.23694 | Break 0.17228 then it’s over | Watch 0.2702
$SYN , I’m bullish on this move.
Supertrend is trending up, and MACD bullish momentum is active; open interest in the past 24 hours surged 34.6%.
Whether it works comes down to whether the longs can hold the key support zone.
The chart won’t lie—look at the structure.
Recent high: 0.27716; recent low: 0.17228.
Bollinger upper band: 0.2702; middle band: 0.2303; lower band: 0.1904. Price is running above the middle band.
Supertrend remains upward; RSI is 57.5—healthy range, no oversold-to-overbought “overheat” baggage; MACD keeps bullish momentum.
Next, let’s look at the funding/flow.
Derivatives data is moving in the same direction.
In the past 24 hours, trading volume was $109 million, open interest was $12.74 million. The 24-hour surge of 34.6% suggests incremental capital is flowing in—not just existing liquidity chewing itself up.
Funding rate: +0.0050%. Longs are paying, but the magnitude is mild, with no overheating signals.
In the long/short ratio: long accounts are 46%, and the active buy/sell ratio is 0.94.
Set the levels clearly—don’t make up your own narrative.
For the longs, first watch the 0.2303 to 0.23694 zone. It’s more suitable to wait for confirmation after a pullback and rebound.
If it’s held, then continue looking higher.
The invalidation reference is at 0.17228. If price breaks below it, this bullish idea is over—don’t linger; admit it and exit immediately.
For the upside extension to watch: 0.2702. If the breakout continues with volume, then look toward the pressure near 0.27716.
Everything is laid out here—when the conditions trigger, move. Don’t rush in.
Let me say something not-so-nice: this setup isn’t flawless.
The active buy/sell ratio is 0.94, and the buy side isn’t clearly dominant; the short side’s ability to absorb in this rally is still not weak.
In the past 24 hours it’s already up 34.45%; the pullback risk from chasing is not low. The reference risk/reward is only 0.5—so the value isn’t very comfortable.
These risks are out in the open. Judge timing and position size yourself—don’t just pick the parts that sound good.
For reference only, not investment advice. Leverage is involved in the contract; investing has risk.
This article is assisted by the Grok xAI model from Musk.
$SYN
#Contract View
$SYN Bullish | Hold 0.2303 - 0.23694 | Break 0.17228 then it’s over | Watch 0.2702
$SYN , I’m bullish on this move.
Supertrend is trending up, and MACD bullish momentum is active; open interest in the past 24 hours surged 34.6%.
Whether it works comes down to whether the longs can hold the key support zone.
The chart won’t lie—look at the structure.
Recent high: 0.27716; recent low: 0.17228.
Bollinger upper band: 0.2702; middle band: 0.2303; lower band: 0.1904. Price is running above the middle band.
Supertrend remains upward; RSI is 57.5—healthy range, no oversold-to-overbought “overheat” baggage; MACD keeps bullish momentum.
Next, let’s look at the funding/flow.
Derivatives data is moving in the same direction.
In the past 24 hours, trading volume was $109 million, open interest was $12.74 million. The 24-hour surge of 34.6% suggests incremental capital is flowing in—not just existing liquidity chewing itself up.
Funding rate: +0.0050%. Longs are paying, but the magnitude is mild, with no overheating signals.
In the long/short ratio: long accounts are 46%, and the active buy/sell ratio is 0.94.
Set the levels clearly—don’t make up your own narrative.
For the longs, first watch the 0.2303 to 0.23694 zone. It’s more suitable to wait for confirmation after a pullback and rebound.
If it’s held, then continue looking higher.
The invalidation reference is at 0.17228. If price breaks below it, this bullish idea is over—don’t linger; admit it and exit immediately.
For the upside extension to watch: 0.2702. If the breakout continues with volume, then look toward the pressure near 0.27716.
Everything is laid out here—when the conditions trigger, move. Don’t rush in.
Let me say something not-so-nice: this setup isn’t flawless.
The active buy/sell ratio is 0.94, and the buy side isn’t clearly dominant; the short side’s ability to absorb in this rally is still not weak.
In the past 24 hours it’s already up 34.45%; the pullback risk from chasing is not low. The reference risk/reward is only 0.5—so the value isn’t very comfortable.
These risks are out in the open. Judge timing and position size yourself—don’t just pick the parts that sound good.
For reference only, not investment advice. Leverage is involved in the contract; investing has risk.
This article is assisted by the Grok xAI model from Musk.
$SYN
#Contract View