$WLD I sold part of my position #wld to buy back lower because technically the price should pull back a bit more, to take a new bullish momentum.
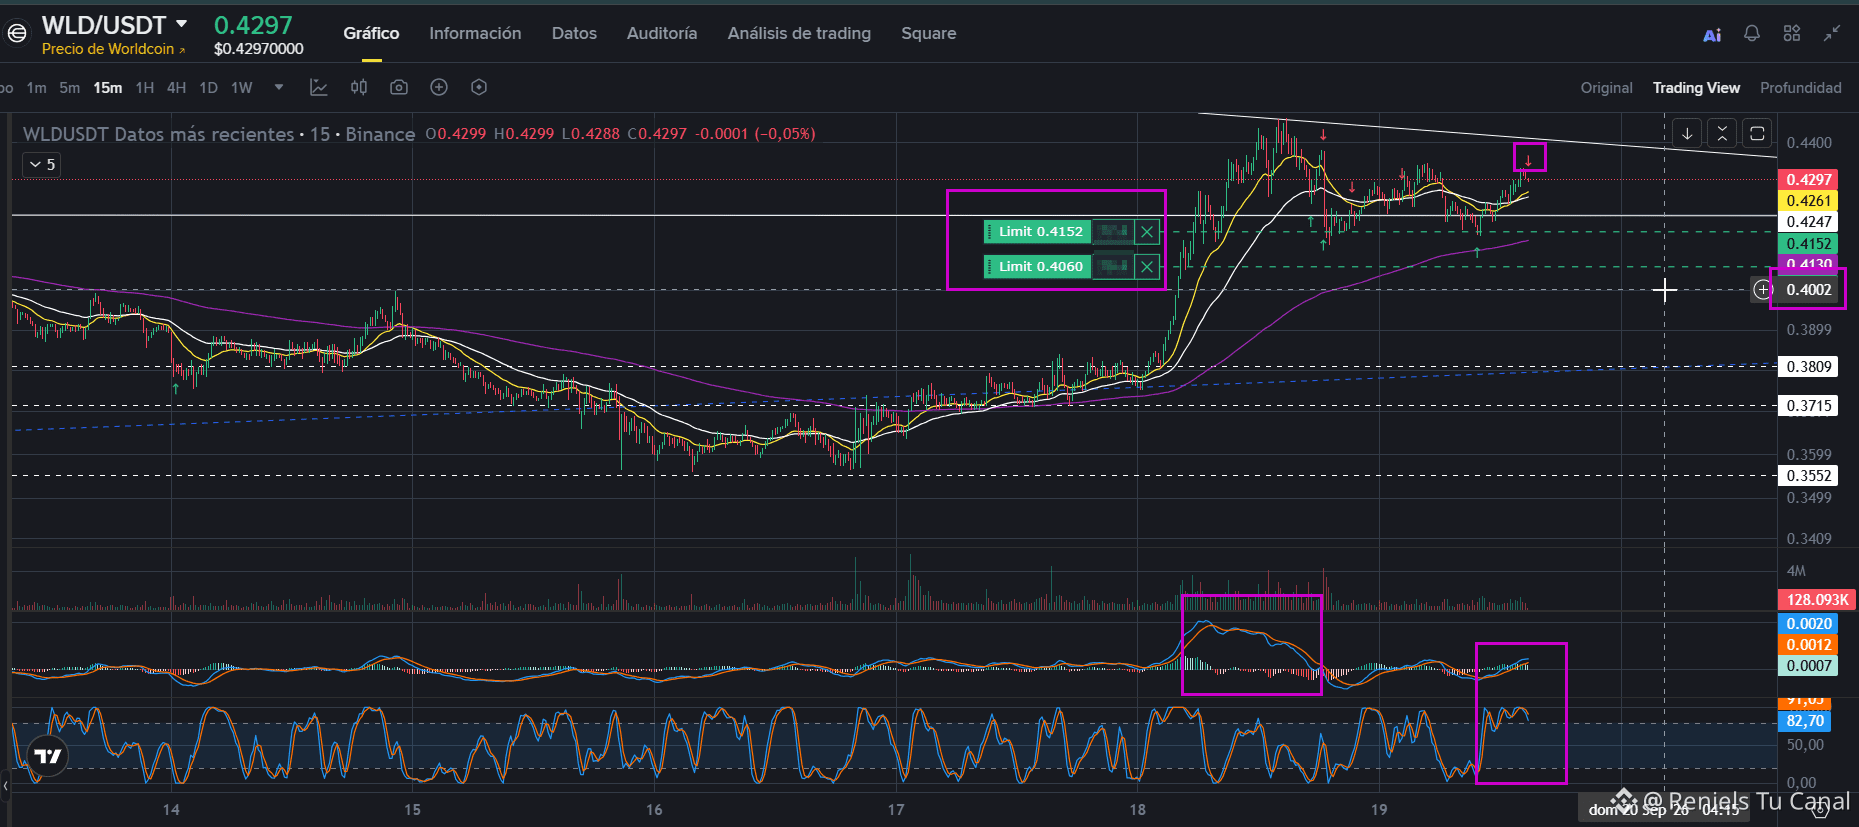
In my image you can see the little red arrow marked as sell, and that I place it to buy back lower. I did it because even though the price went up, it didn’t do it with the same strength when it reached 0.445 (the area where I sold at the time too), and now the SRI already shows the exhaustion of the overbought condition.
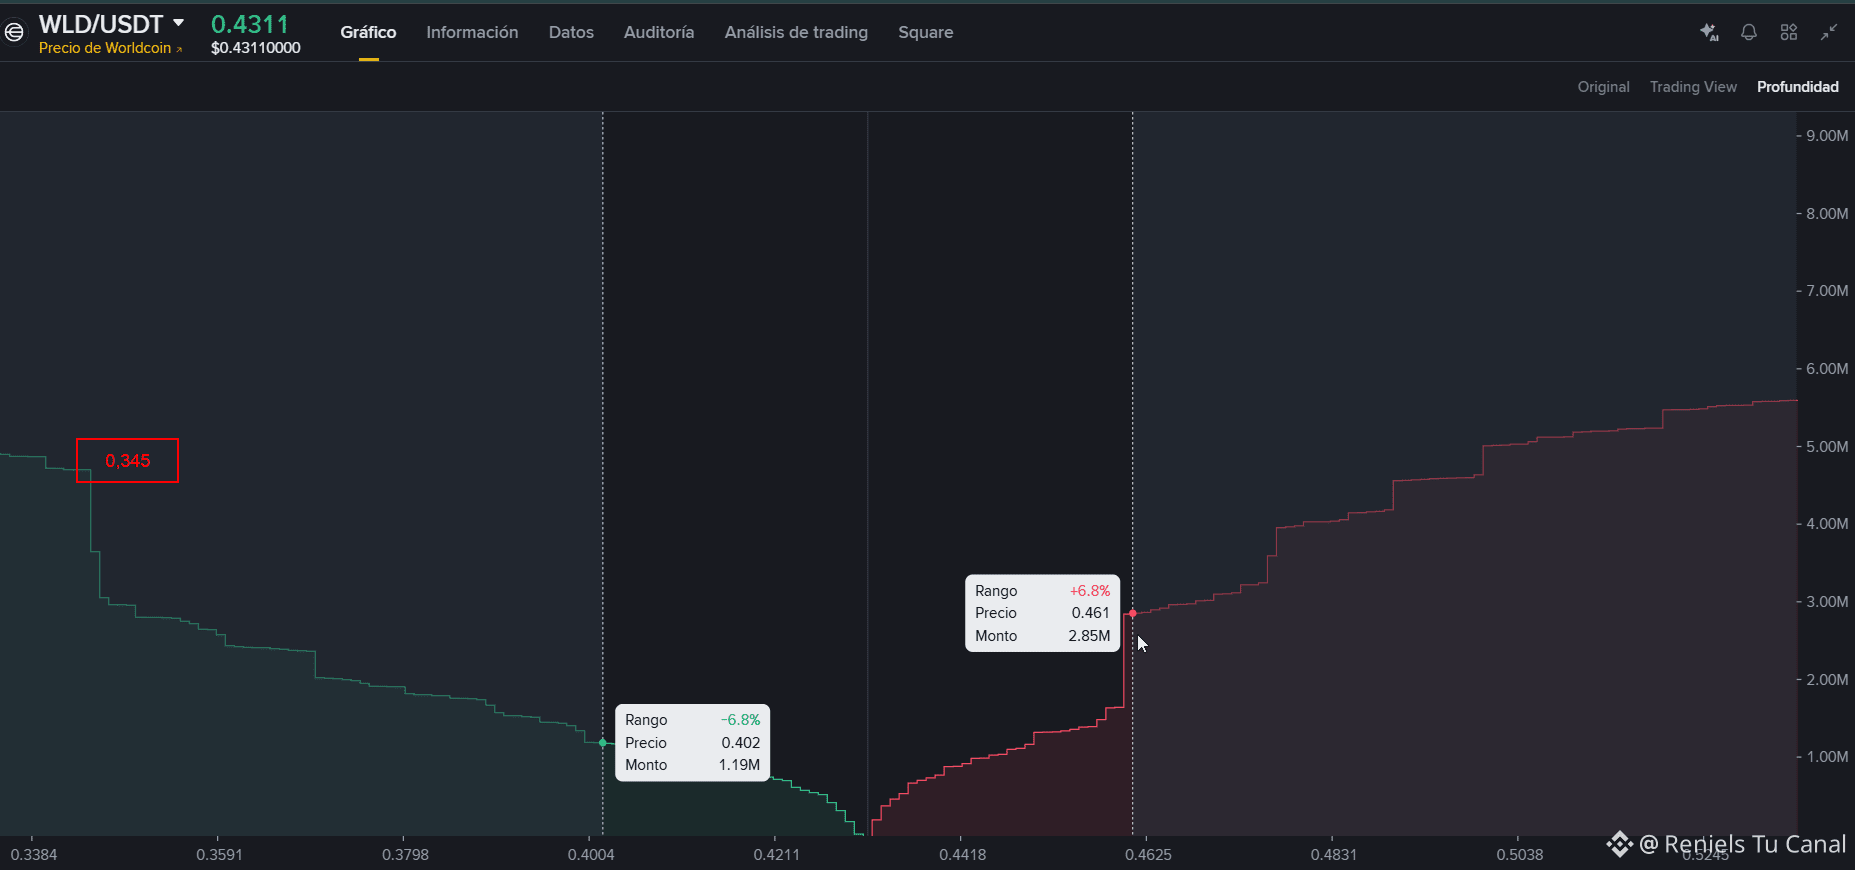
In the depth photo there are two key prices: one for a possible resistance at 0.461 and another for a possible resistance at 0.345, due to the number of buy and sell orders placed.
In the third photo, using a more distant timeframe, you can see that in the long run, in this WLD recovery, the price has rebounded off the thick dashed line, which shows a healthy slope and a healthy speed; therefore, I think it should test that line again before moving forward.
And if you look at all the arrows, they are the history of my sell operations at the highs and my buys at the lows, to gradually increase my position in this project.
What do you think?
In my image you can see the little red arrow marked as sell, and that I place it to buy back lower. I did it because even though the price went up, it didn’t do it with the same strength when it reached 0.445 (the area where I sold at the time too), and now the SRI already shows the exhaustion of the overbought condition.
In the depth photo there are two key prices: one for a possible resistance at 0.461 and another for a possible resistance at 0.345, due to the number of buy and sell orders placed.
In the third photo, using a more distant timeframe, you can see that in the long run, in this WLD recovery, the price has rebounded off the thick dashed line, which shows a healthy slope and a healthy speed; therefore, I think it should test that line again before moving forward.
And if you look at all the arrows, they are the history of my sell operations at the highs and my buys at the lows, to gradually increase my position in this project.
What do you think?