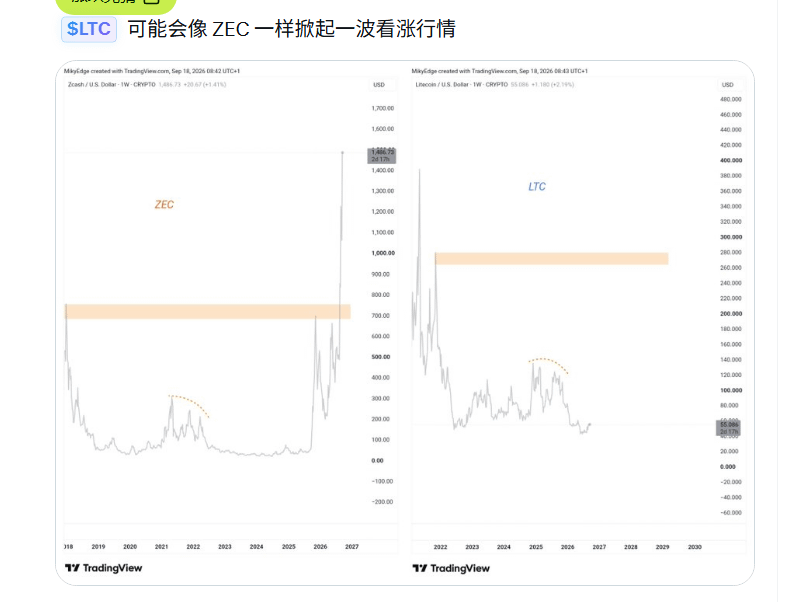
The weekly chart comparison of ZEC and LTC suggests that LTC may, like ZEC, trigger a bullish wave. ZEC previously surged from the lows all the way to over a thousand dollars; LTC is still hovering in the mid-$50s, and the chart marks a target range. The direction is only one person’s opinion—historical price action never guarantees a repeat. You can look at the chart, but whether to follow it is something you should do your own research on. #比特币突破8万美元大关