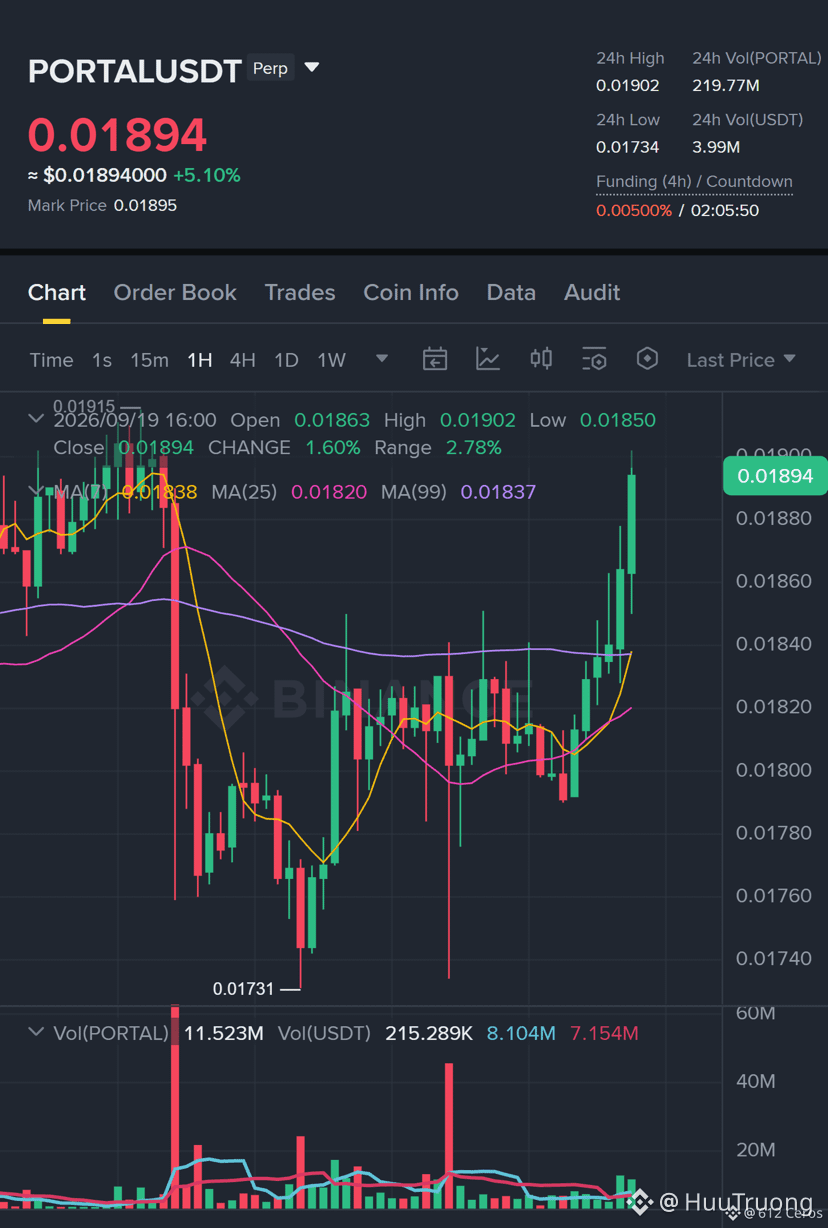
PORTAL isn’t just a jump— the machine is igniting.
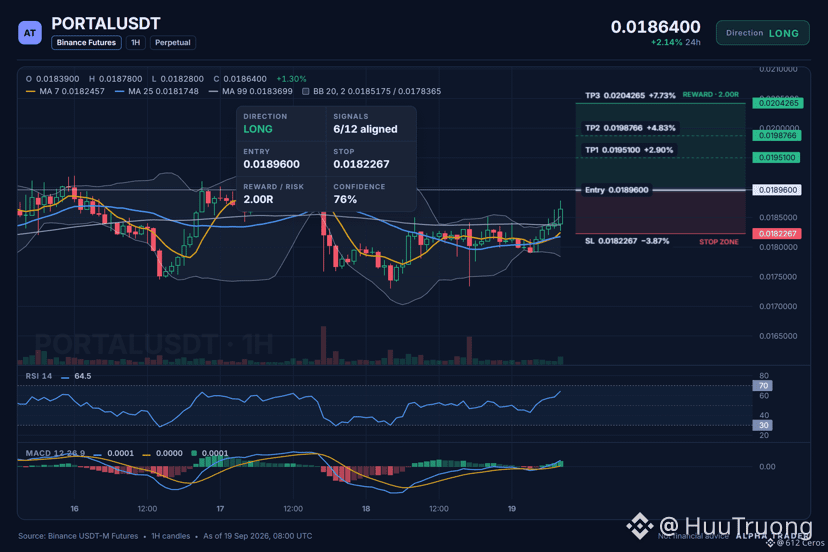
📊 $PORTAL /USDT · Bias: LONG (Bullish) · 6/12 confirming signals
Technical conclusion: STRONG LONG. 6/12 confirming signals, 0 opposing signals.
✅ Daily trend: price > EMA50 > EMA200, rising stack
✅ 4h trend: price > EMA50 > EMA200, rising stack
✅ 1h trend: price > EMA50 > EMA200, rising stack
✅ Trend strength (ADX/DI, 15m): ADX 40.3 with buyers in control (DI+ 28.9 vs DI− 10.3)
✅ RSI 1h: 64.5, momentum increasing (above 55)
✅ Short-term momentum (15m): RSI z-score +2.20, latest candle +2.38%, buyers are pressing
Nothing is going against it right now.
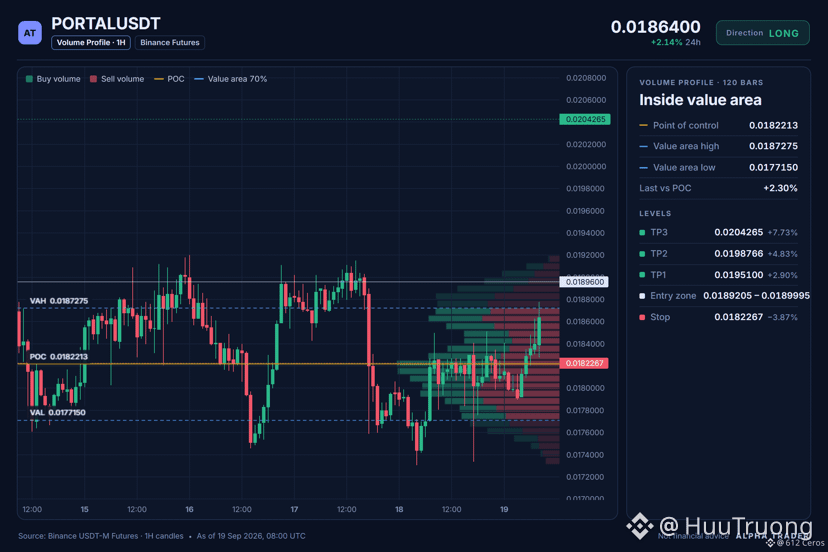
📍 Entry: 0.0189205 – 0.0189995
🎯 TP1: 0.0195100 | TP2: 0.0198766 | TP3: 0.0204265
🛑 SL: 0.0182267
Reasons:
The daily trend is bullish because price is above EMA50 and EMA200, and RSI 1h at 64.14 confirms upward momentum without being overextended. The 1h ATR is 0.000306, setting the measurement “pace” for the move from the entry zone between 0.0189205 and 0.0189995 toward TP1 at 0.0195100 and TP2 at 0.0198766, while ADX 40.3 with DI+ 28.9 shows buyers are holding very strong control. If the structure breaks, the invalidation level is at 0.0176705.
At what level will you invalidate this LONG trade when a pullback occurs?
All the setup on the chart 👇
⚠️ This is just personal market analysis. NFA — manage risk and DYOR.
Educational content only, not investment advice or a recommendation to buy, sell, deposit, or withdraw any assets. No paid promotion or referral/affiliate links.
📊 $PORTAL /USDT · Bias: LONG (Bullish) · 6/12 confirming signals
Technical conclusion: STRONG LONG. 6/12 confirming signals, 0 opposing signals.
✅ Daily trend: price > EMA50 > EMA200, rising stack
✅ 4h trend: price > EMA50 > EMA200, rising stack
✅ 1h trend: price > EMA50 > EMA200, rising stack
✅ Trend strength (ADX/DI, 15m): ADX 40.3 with buyers in control (DI+ 28.9 vs DI− 10.3)
✅ RSI 1h: 64.5, momentum increasing (above 55)
✅ Short-term momentum (15m): RSI z-score +2.20, latest candle +2.38%, buyers are pressing
Nothing is going against it right now.
📍 Entry: 0.0189205 – 0.0189995
🎯 TP1: 0.0195100 | TP2: 0.0198766 | TP3: 0.0204265
🛑 SL: 0.0182267
Reasons:
The daily trend is bullish because price is above EMA50 and EMA200, and RSI 1h at 64.14 confirms upward momentum without being overextended. The 1h ATR is 0.000306, setting the measurement “pace” for the move from the entry zone between 0.0189205 and 0.0189995 toward TP1 at 0.0195100 and TP2 at 0.0198766, while ADX 40.3 with DI+ 28.9 shows buyers are holding very strong control. If the structure breaks, the invalidation level is at 0.0176705.
At what level will you invalidate this LONG trade when a pullback occurs?
All the setup on the chart 👇
⚠️ This is just personal market analysis. NFA — manage risk and DYOR.
Educational content only, not investment advice or a recommendation to buy, sell, deposit, or withdraw any assets. No paid promotion or referral/affiliate links.