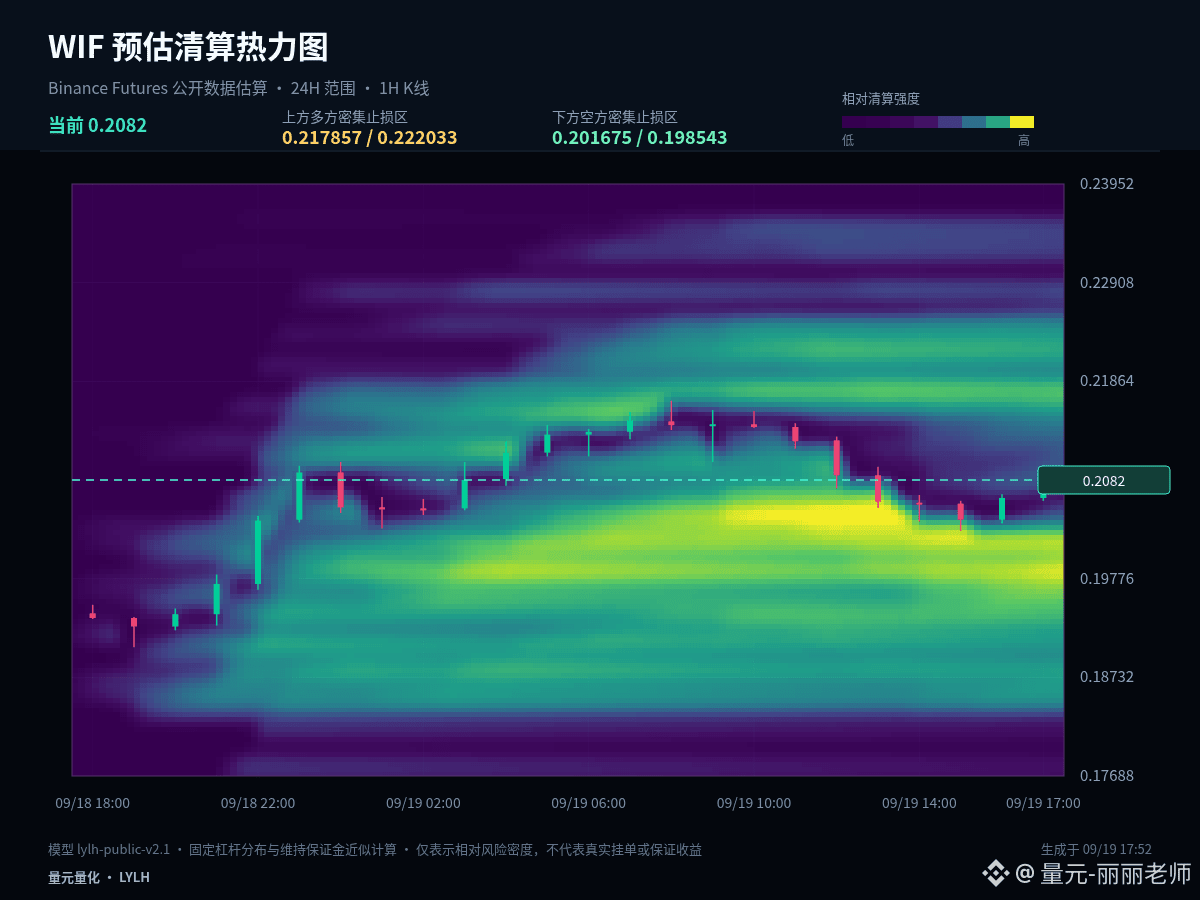
$WIF #WIF In the meantime, place the conclusions first: hold at 0.2037, and only then is there a condition to continue testing 0.2166. Current price: 0.2083. 1-hour: +0.92%, 24-hour: +7.09%.
Right now, the 1-hour (+0.92%) and 24-hour (+7.09%) periods have not formed a sufficiently clear, same-direction alignment. In a range market, the tolerance for chasing rallies and killing positions is lower. It’s more suitable to confirm direction using the upper band, and confirm pullback/rejection using the lower band; the mid-axis is only used as the strength/weakness boundary.
On key levels: 0.2037 is the current structure mid-axis and also the first benchmark for judging whether a pullback is healthy. As long as price can stabilize above it, the bulls still retain initiative. The upside to watch first is 0.2166. If price falls back below the mid-axis, then focus shifts to the secondary support at 0.1908.
My scenario analysis is not single-minded. Breaking above 0.2166 and being able to hold it means upside space has been re-opened. Breaking below 0.1908 and failing to reclaim it means the structure weakens further. If price trades between the two, continue observing the candle closes on both sides of 0.2037.
For those who already hold positions, the key is to manage based on whether support fails, not to be dragged around by every fluctuation. For those with no position, prioritize waiting for a breakout followed by a pullback confirmation, or for support confirmation. Spot holdings can be built in batches; for contracts, you should shorten the decision chain—first determine the stop-loss area, then decide whether to participate.
Simplifying the conclusion doesn’t mean simplifying risk control. When executing, you still need to wait for price confirmation and leave room to exit if your judgment proves wrong. Next, I will focus on tracking the gains/losses around 0.2037. Do you think it’s more likely to first test 0.2166, or to first return to 0.1908? Feel free to share your view and reasoning.
#LineraShutsDownAfterFundraisingFallsShort
Right now, the 1-hour (+0.92%) and 24-hour (+7.09%) periods have not formed a sufficiently clear, same-direction alignment. In a range market, the tolerance for chasing rallies and killing positions is lower. It’s more suitable to confirm direction using the upper band, and confirm pullback/rejection using the lower band; the mid-axis is only used as the strength/weakness boundary.
On key levels: 0.2037 is the current structure mid-axis and also the first benchmark for judging whether a pullback is healthy. As long as price can stabilize above it, the bulls still retain initiative. The upside to watch first is 0.2166. If price falls back below the mid-axis, then focus shifts to the secondary support at 0.1908.
My scenario analysis is not single-minded. Breaking above 0.2166 and being able to hold it means upside space has been re-opened. Breaking below 0.1908 and failing to reclaim it means the structure weakens further. If price trades between the two, continue observing the candle closes on both sides of 0.2037.
For those who already hold positions, the key is to manage based on whether support fails, not to be dragged around by every fluctuation. For those with no position, prioritize waiting for a breakout followed by a pullback confirmation, or for support confirmation. Spot holdings can be built in batches; for contracts, you should shorten the decision chain—first determine the stop-loss area, then decide whether to participate.
Simplifying the conclusion doesn’t mean simplifying risk control. When executing, you still need to wait for price confirmation and leave room to exit if your judgment proves wrong. Next, I will focus on tracking the gains/losses around 0.2037. Do you think it’s more likely to first test 0.2166, or to first return to 0.1908? Feel free to share your view and reasoning.
#LineraShutsDownAfterFundraisingFallsShort