
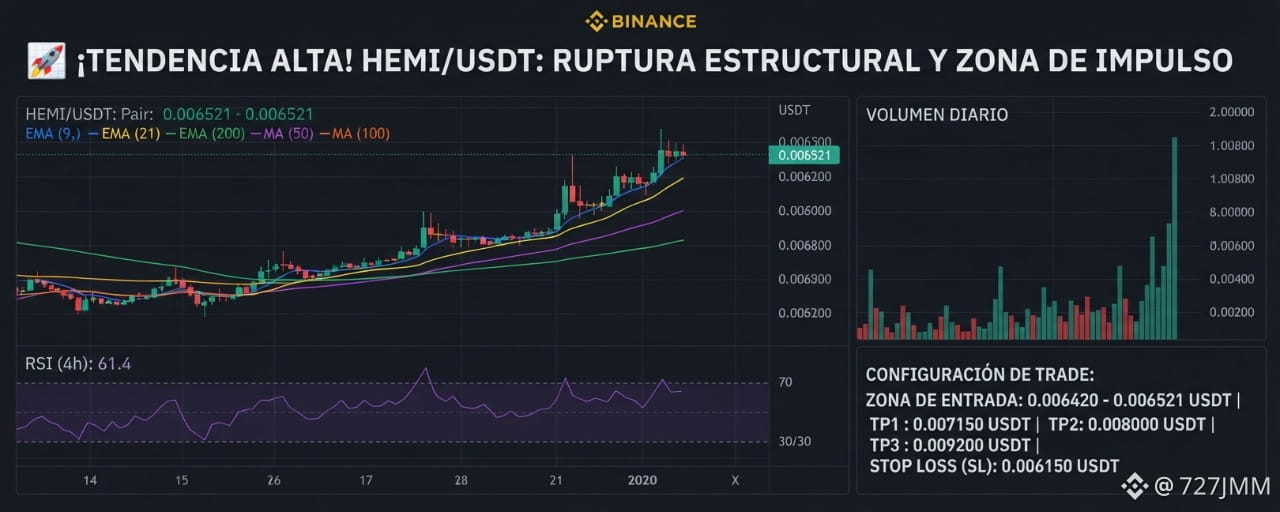


Situation Analysis In timeframes of 1h, 4h, and daily, HEMI shows a solid transition from an accumulation phase toward a fully defined bullish trend. The EMAs (9 and 21) maintain a bullish cross (Golden Cross) above the MA (50), while price consolidates comfortably above the EMA 200 on the daily chart. The RSI in the 4h timeframe is at 61.4, operating freely in the bullish control zone with no signs of exhaustion or extreme overbought conditions. Volume supports the move with increasing accumulation bars that confirm institutional interest in breaking out of the current zone.
Trade Setup Configuration
Ideal Entry Zone: $0.006420 - $0.006521 (Current retest range of the breakout)
TP1 (Conservative): $0.007150 (Initial target to secure profits / Fibonacci Resistance)
TP2 (Intermediate): $0.008000 (Target based on the next technical and psychological resistance)
TP3 (Moonshot): $0.009200 (Extended target from daily bullish channel projection)
Stop Loss (SL): $0.006150 (Mandatory technical invalidation level, below the support structure and the 4h EMA 21)
Trade Range: The entry is based on a precise technical bounce after the $0.006521 level has been tested, directly converging with the EMA 9 on lower timeframes, and an RSI exiting balance zones with buying strength supported by volume.