New update on $AR / USDT— the numbers are getting stronger!
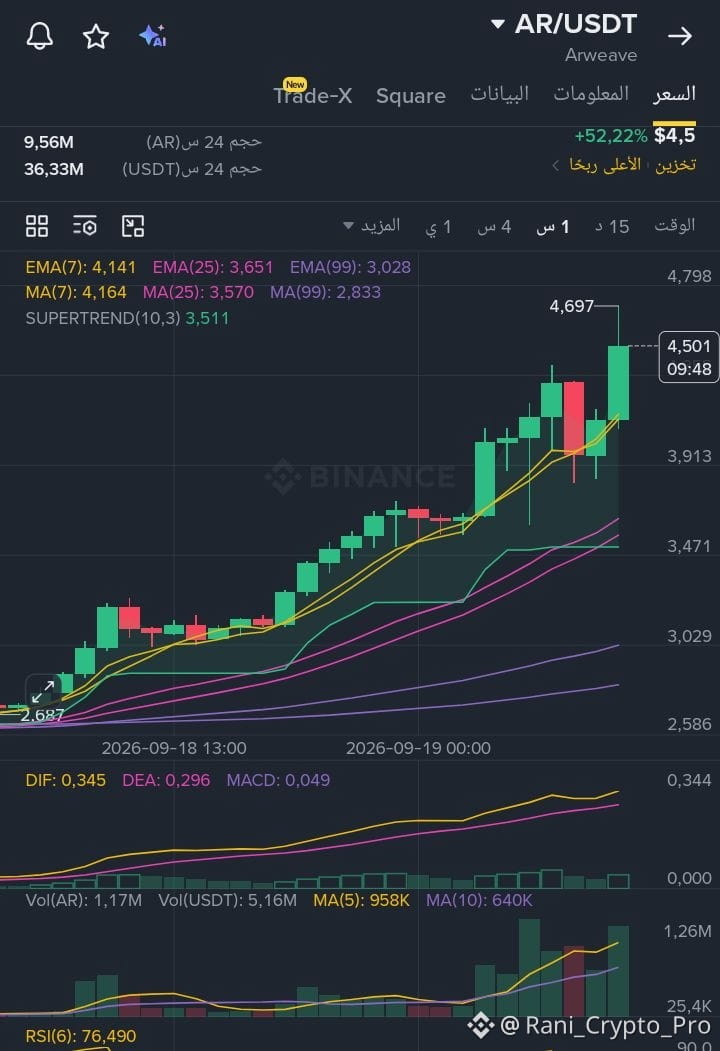
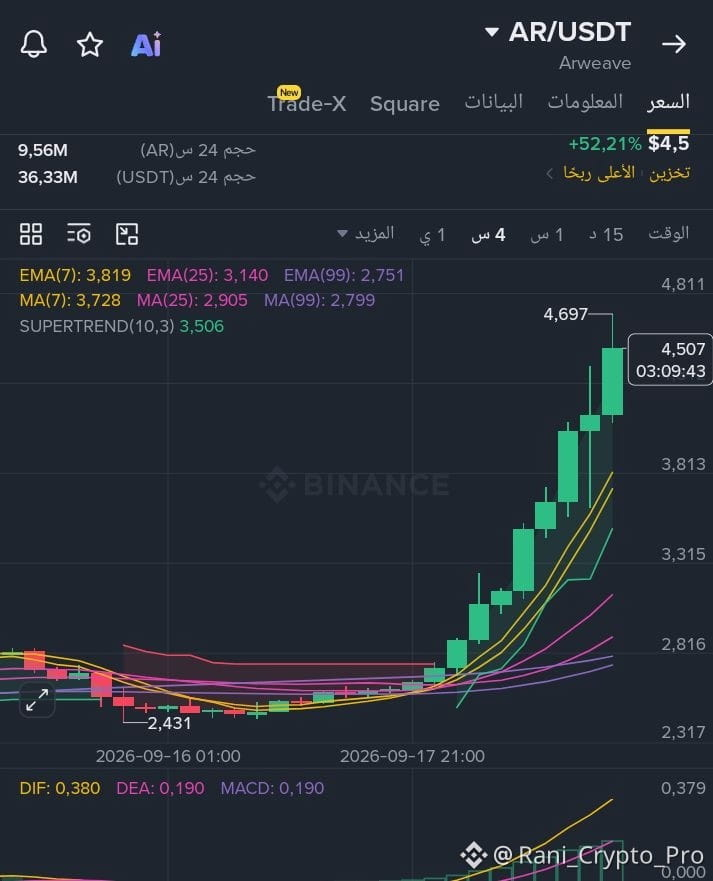
AR is now around $4.50 after a strong bullish wave that surged over 52% in 24 hours, setting a new peak near $4.69.
Most importantly for me, this rise didn’t come alone:
💰 The money flow surged and reached about 1.23M in the latest period.
📊 Total visible buy orders: about 4.43M AR versus 3.48M AR for sells.
📈 Price is still above EMA7, EMA25, and EMA99 on the key timeframes.
🔥 MACD is positive and momentum is still rising.
📈 OBV is rising strongly, reflecting increased activity and liquidity alongside the move.
But there’s a very important point ⚠️
RSI on the 4-hour timeframe reached around 99, and on the hourly chart it’s about 76—meaning the move has become extremely strong and has entered a clear overbought zone.
So I’m watching two levels right now:
🎯 $4.69 → the current high; breaking above it and holding there is important for the continuation of momentum.
🛡️ $4.40–$4.20 → an important zone to watch the strength of the price if profit-taking happens.
AR is not in a normal move… liquidity and momentum are very clear, but after this price explosion, the correction must be monitored with the same importance as the rally.
If it holds support and breaks $4.69 with consistency, we’ll watch higher levels next. But if support breaks, it could give the market a chance to catch its breath.
Technical analysis based on the current charts/images, not a guarantee of results or financial advice.
AR is now around $4.50 after a strong bullish wave that surged over 52% in 24 hours, setting a new peak near $4.69.
Most importantly for me, this rise didn’t come alone:
💰 The money flow surged and reached about 1.23M in the latest period.
📊 Total visible buy orders: about 4.43M AR versus 3.48M AR for sells.
📈 Price is still above EMA7, EMA25, and EMA99 on the key timeframes.
🔥 MACD is positive and momentum is still rising.
📈 OBV is rising strongly, reflecting increased activity and liquidity alongside the move.
But there’s a very important point ⚠️
RSI on the 4-hour timeframe reached around 99, and on the hourly chart it’s about 76—meaning the move has become extremely strong and has entered a clear overbought zone.
So I’m watching two levels right now:
🎯 $4.69 → the current high; breaking above it and holding there is important for the continuation of momentum.
🛡️ $4.40–$4.20 → an important zone to watch the strength of the price if profit-taking happens.
AR is not in a normal move… liquidity and momentum are very clear, but after this price explosion, the correction must be monitored with the same importance as the rally.
If it holds support and breaks $4.69 with consistency, we’ll watch higher levels next. But if support breaks, it could give the market a chance to catch its breath.
Technical analysis based on the current charts/images, not a guarantee of results or financial advice.