Grok market watch quick review | 9/19 12:45
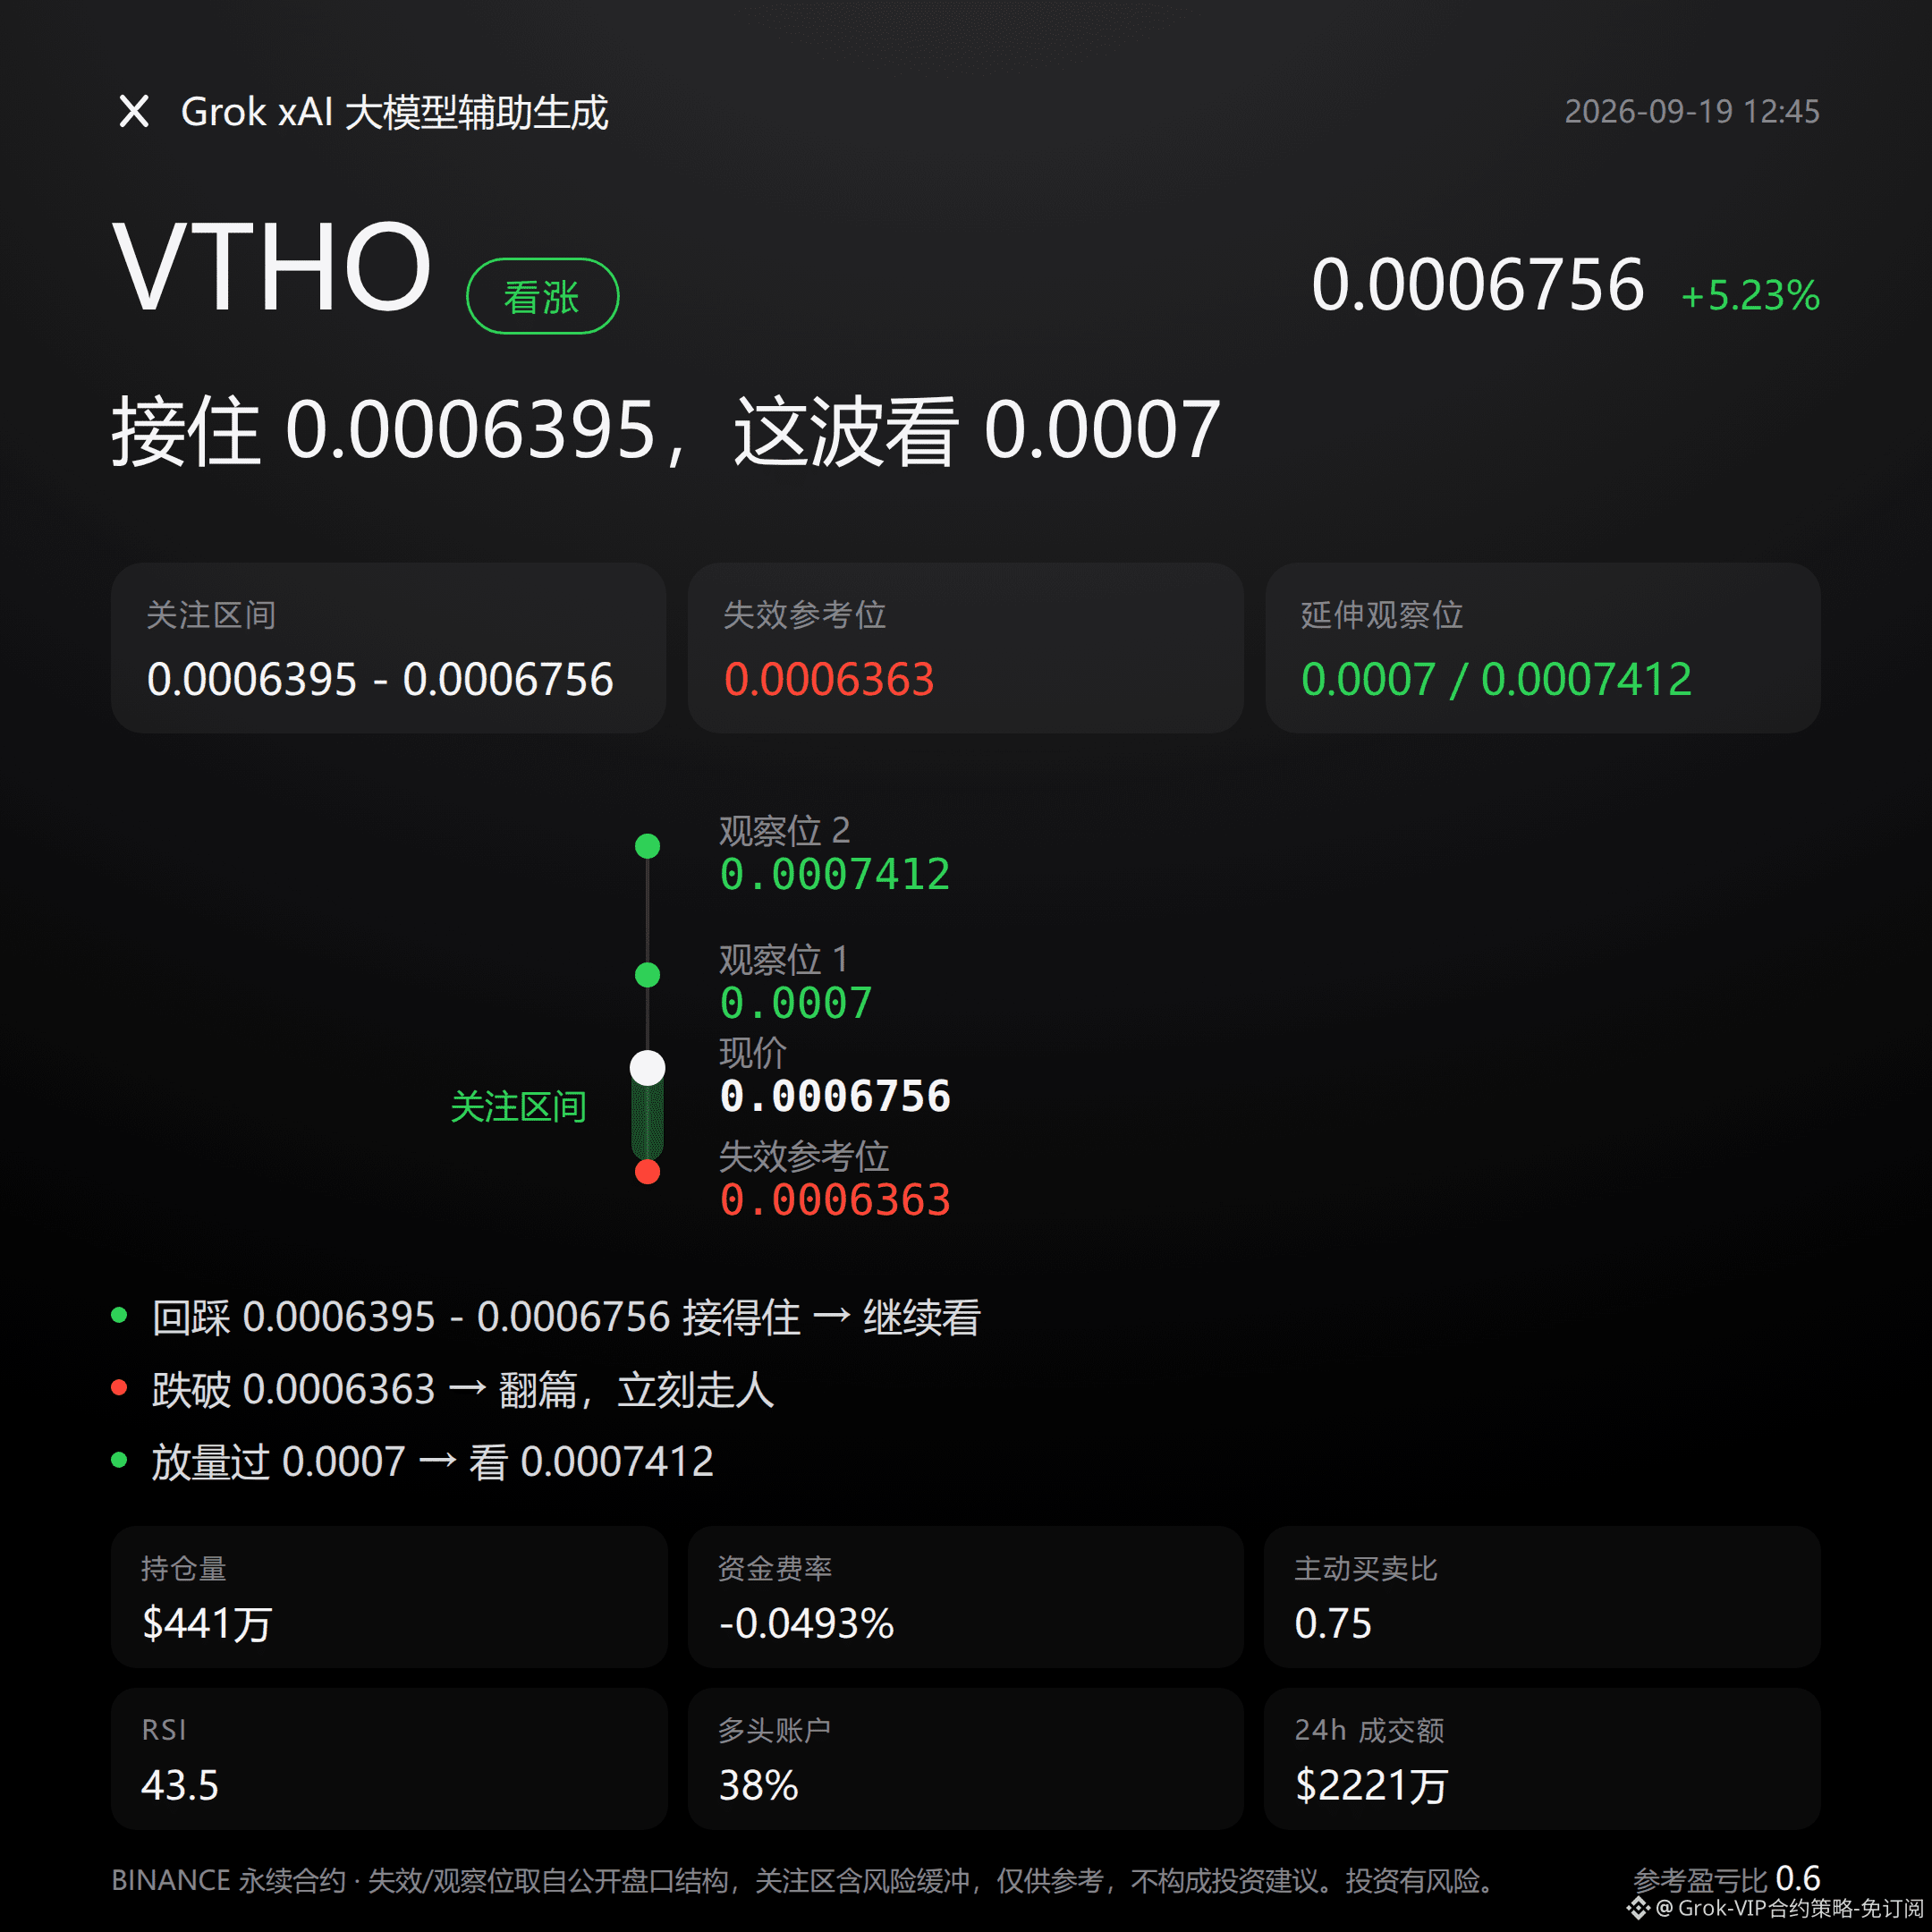
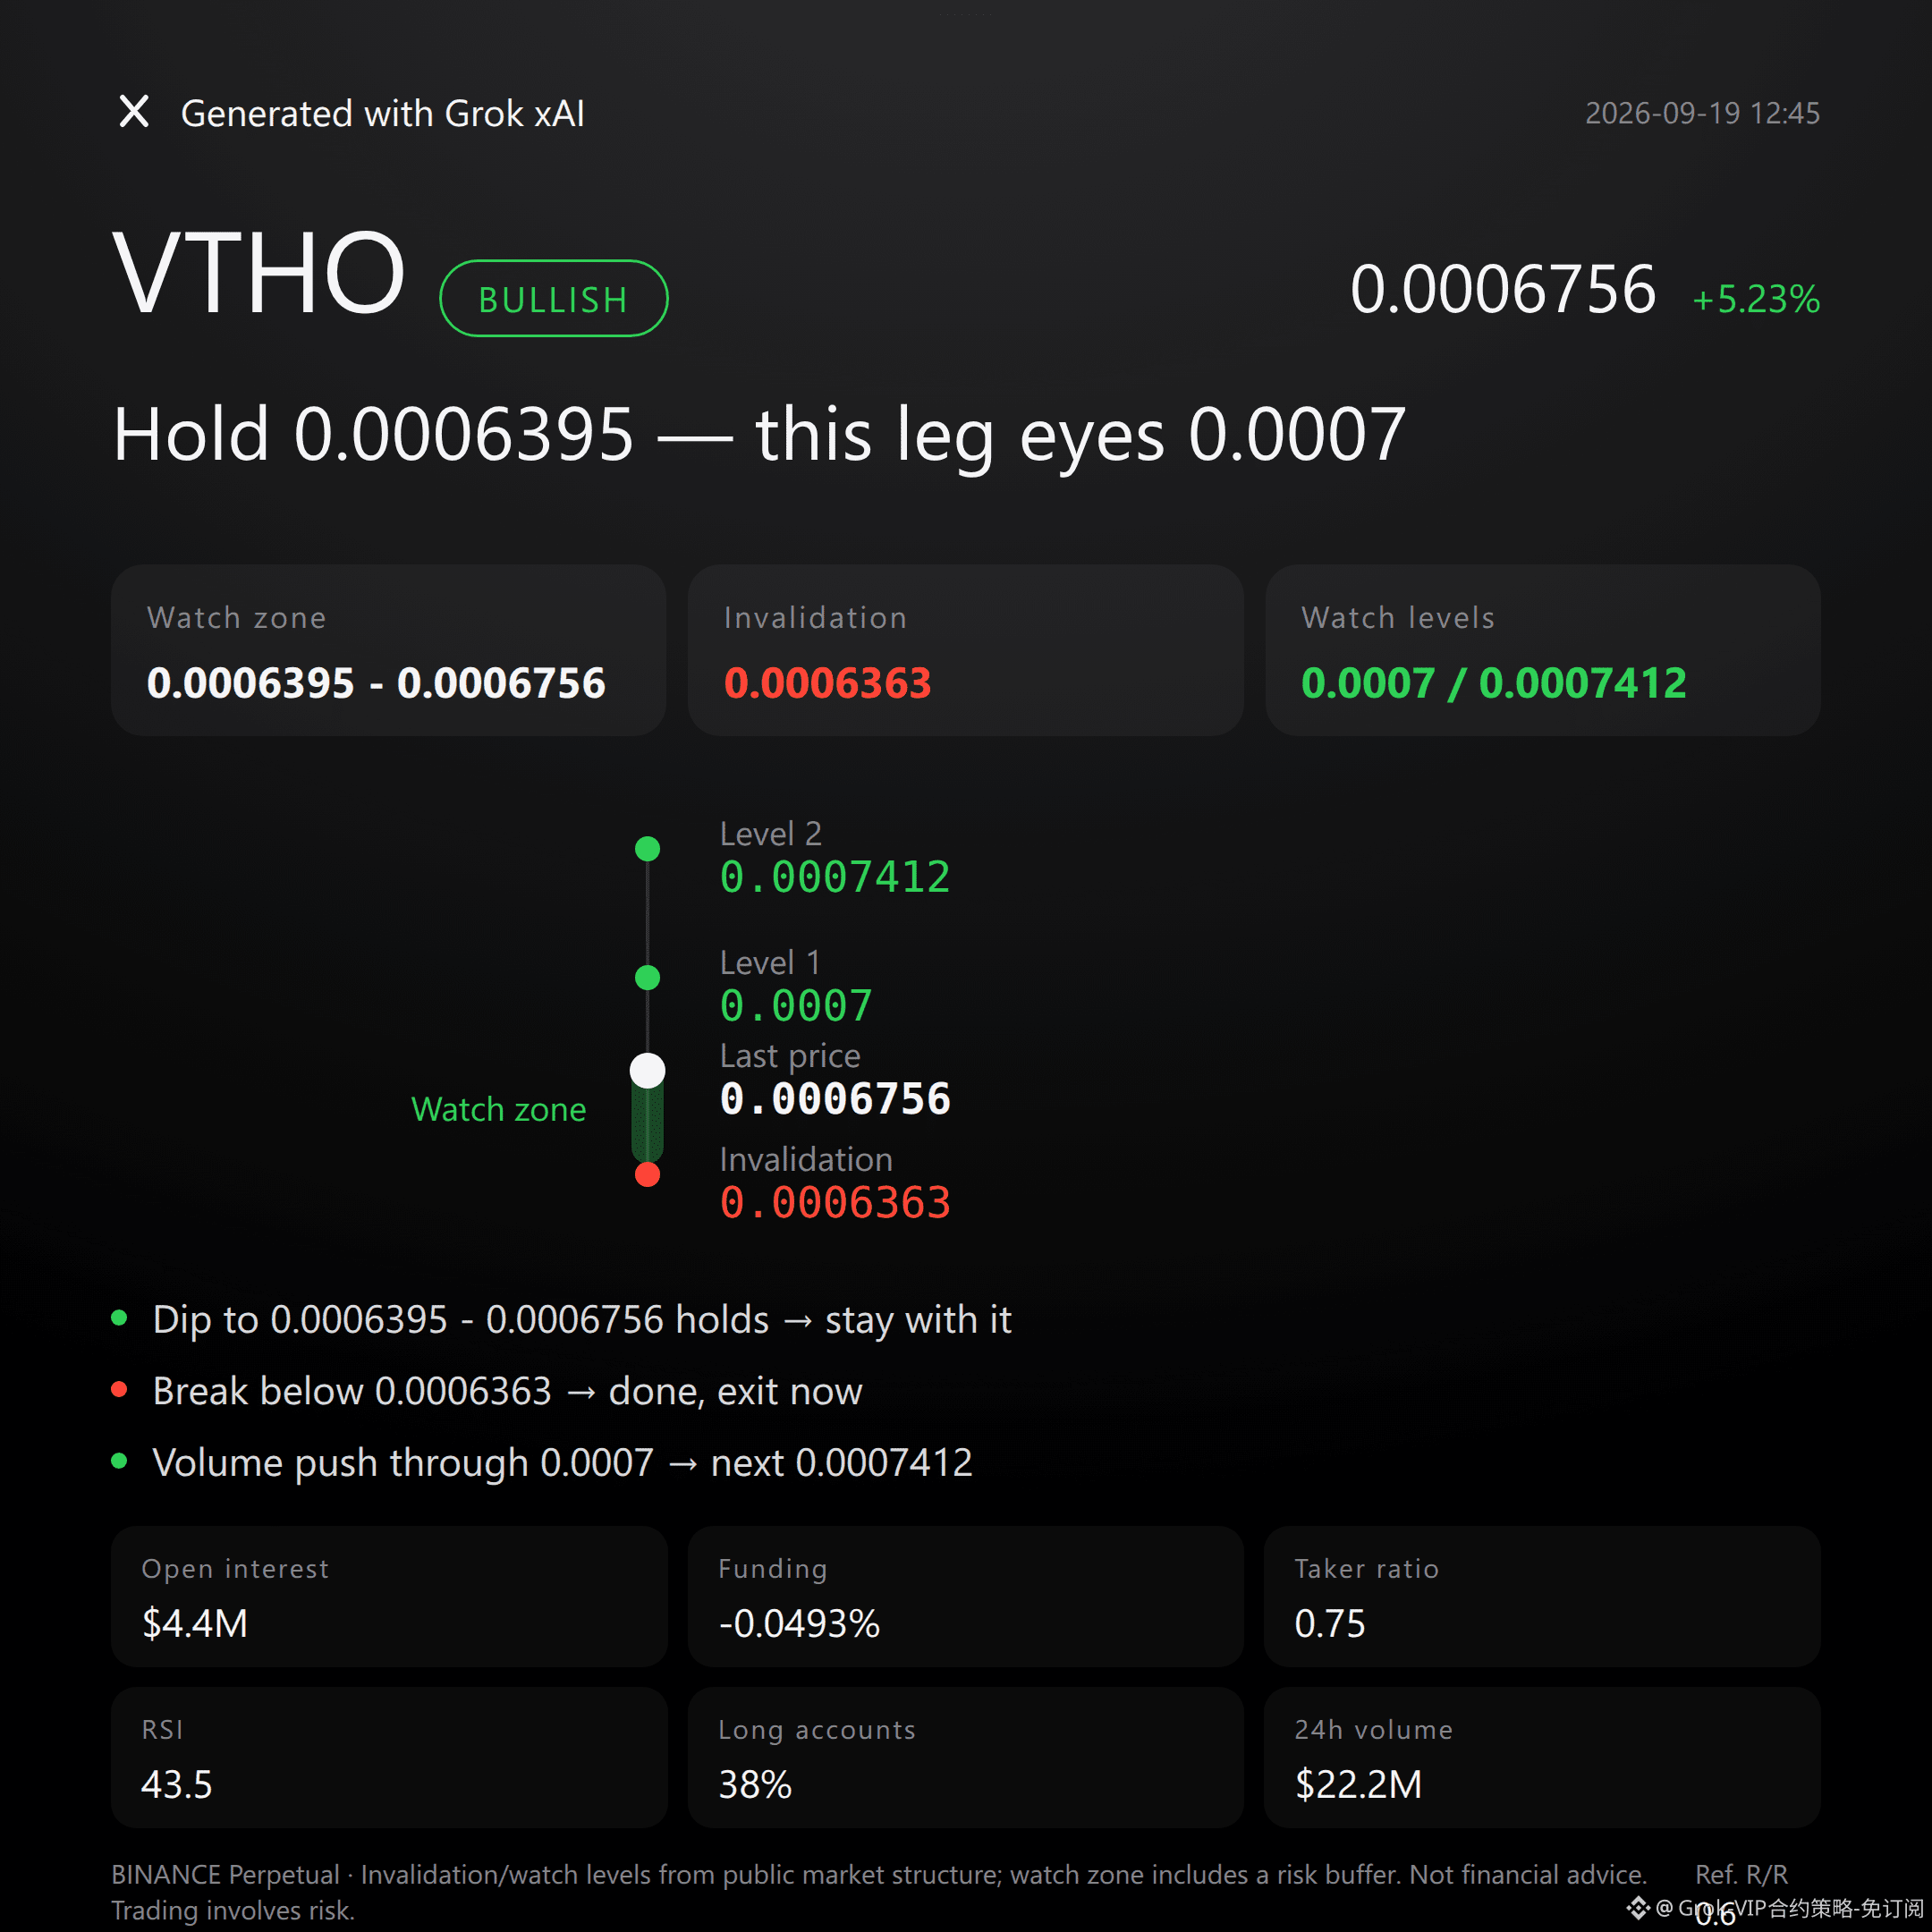
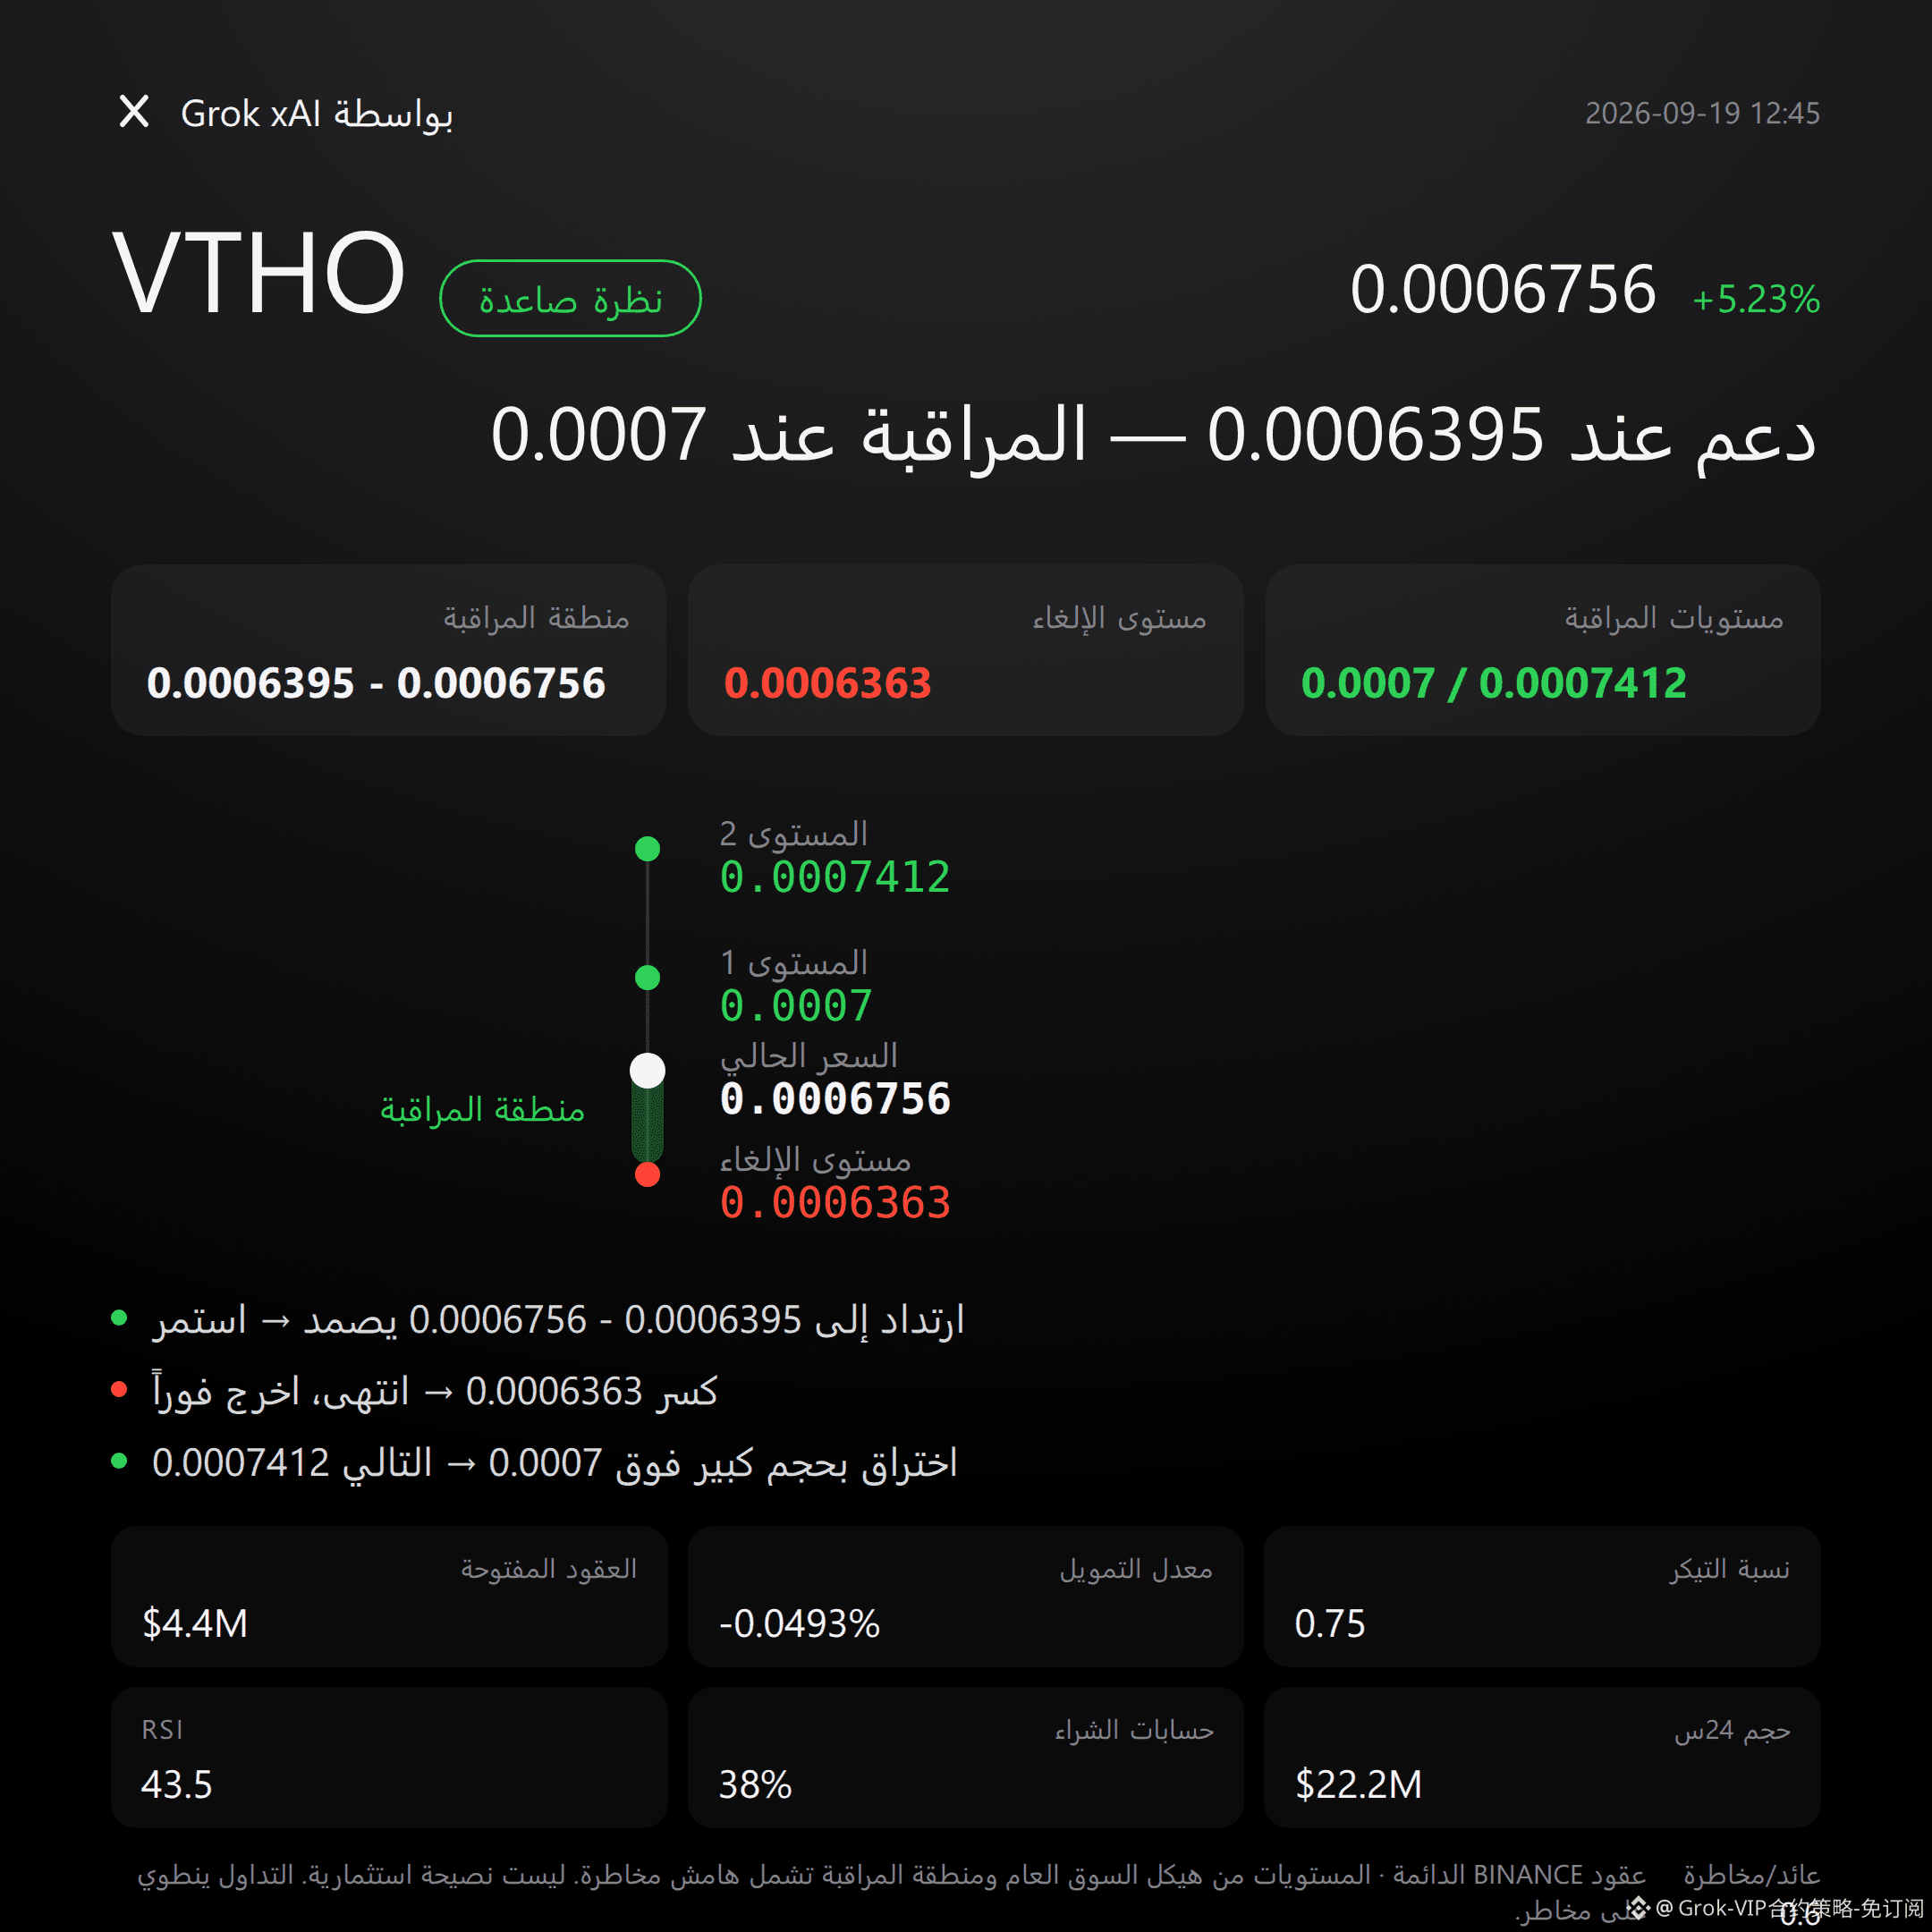
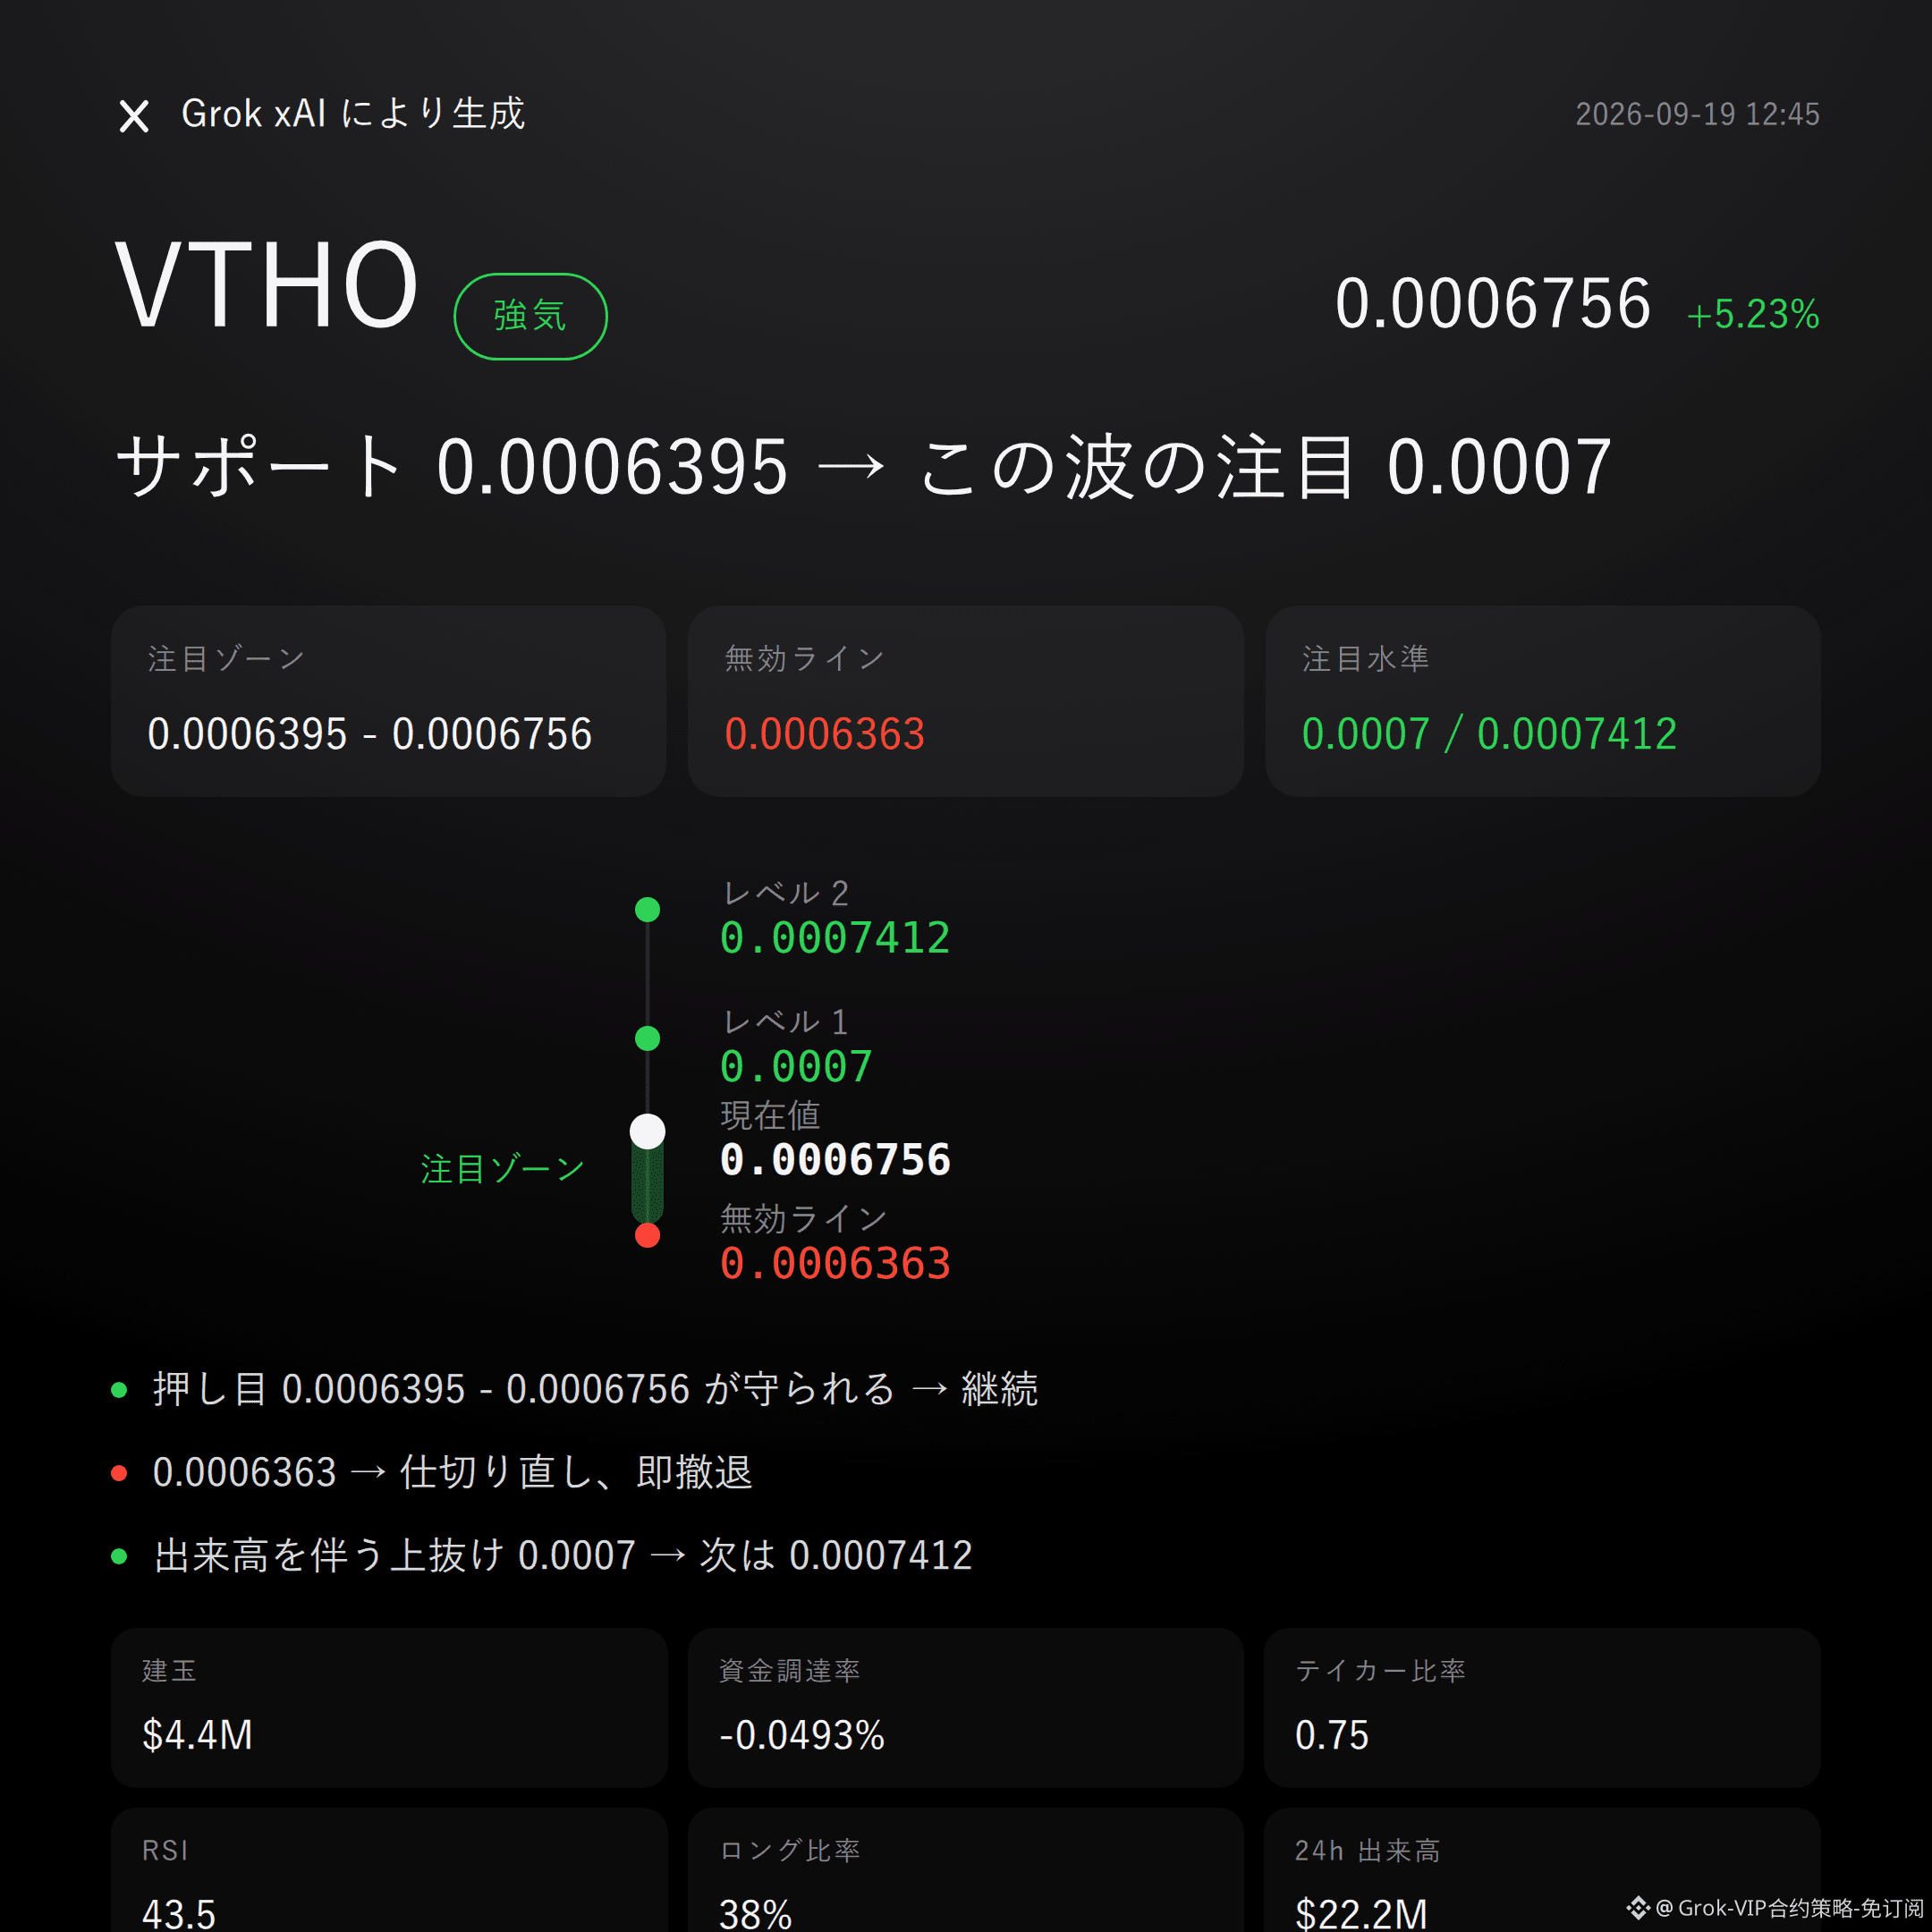
$VTHO bullish | Hold 0.0006395 - 0.0006756 | Break 0.0006363 and move on | Watch 0.0007
$VTHO , this wave—I’m bullish.
Supertrend is rising, MACD bullish momentum is running, and a 24-hour gain of 5.23% is more “in trend” than a counter-trend spike. All three hard indicators point in the same direction.
Whether it works or not, next focus is whether the long side can hold in the key zone. Don’t jump to conclusions yet.
In terms of technical structure: the recent high is 0.0007412, the recent low is 0.0006363, and the current price 0.0006756 is sitting in the upper half of the range.
On the Bollinger Bands, the upper/middle/lower tracks are all clustered around 0.0007, and the band width is relatively narrow—suggesting consolidation is now choosing a direction.
RSI is 43.5: neutral but slightly weak. It hasn’t reached overbought, meaning if it continues to rise, the upside hasn’t been priced in early.
From the derivatives angle, there’s resonance: 24-hour trading volume is $22.21 million, open interest is $4.41 million, and open interest is only down 0.6% over 24 hours—no clear signs of significant position reduction or exit.
Funding rate is -0.0493%. The shorts are effectively “paying” the longs. Sentiment is bearish, but price action is more bullish—this divergence is worth keeping an eye on.
Only 38% of accounts are long. Fewer longs doesn’t automatically mean the direction is wrong, but it does suggest this up move isn’t built on everyone piling into longs in unison.
On the levels: the conditions are clear. The long side is watching the 0.0006395–0.0006756 zone first. It’s more suitable to wait for a pullback and holding/support before confirming—don’t chase this move right now.
If that zone holds, continue to look for this bullish structure. If it breaks below 0.0006363, then the bullish thesis is over—don’t linger, don’t stubbornly hold onto it, and don’t invent reasons.
If there’s a volume-backed breakout above 0.0007, then look toward the 0.0007412 area for the next resistance check—whether it can stand there will be the next judgment point.
All the conditions are laid out. Wait for the trigger—don’t run in early.
Let me say something not so nice: the active buy/sell ratio is only 0.75, and the buy side isn’t taking clear advantage. This rally looks more like shorts paying via funding rate and being forced to close, rather than a result of buyers actively attacking.
The参考盈亏比 (reward-to-risk ratio) is 0.6, which isn’t friendly by itself—meaning even if your directional call is right, the odds don’t clearly favor the longs.
The market won’t lie, but it also won’t stand in for you as a safety net. You have to measure risk yourself.
For reference only; this is not investment advice. Contracts involve leverage, investing is risky.
This article was assisted by the MasK xAI Grok AI model.
$VTHO
#Contract outlook
$VTHO bullish | Hold 0.0006395 - 0.0006756 | Break 0.0006363 and move on | Watch 0.0007
$VTHO , this wave—I’m bullish.
Supertrend is rising, MACD bullish momentum is running, and a 24-hour gain of 5.23% is more “in trend” than a counter-trend spike. All three hard indicators point in the same direction.
Whether it works or not, next focus is whether the long side can hold in the key zone. Don’t jump to conclusions yet.
In terms of technical structure: the recent high is 0.0007412, the recent low is 0.0006363, and the current price 0.0006756 is sitting in the upper half of the range.
On the Bollinger Bands, the upper/middle/lower tracks are all clustered around 0.0007, and the band width is relatively narrow—suggesting consolidation is now choosing a direction.
RSI is 43.5: neutral but slightly weak. It hasn’t reached overbought, meaning if it continues to rise, the upside hasn’t been priced in early.
From the derivatives angle, there’s resonance: 24-hour trading volume is $22.21 million, open interest is $4.41 million, and open interest is only down 0.6% over 24 hours—no clear signs of significant position reduction or exit.
Funding rate is -0.0493%. The shorts are effectively “paying” the longs. Sentiment is bearish, but price action is more bullish—this divergence is worth keeping an eye on.
Only 38% of accounts are long. Fewer longs doesn’t automatically mean the direction is wrong, but it does suggest this up move isn’t built on everyone piling into longs in unison.
On the levels: the conditions are clear. The long side is watching the 0.0006395–0.0006756 zone first. It’s more suitable to wait for a pullback and holding/support before confirming—don’t chase this move right now.
If that zone holds, continue to look for this bullish structure. If it breaks below 0.0006363, then the bullish thesis is over—don’t linger, don’t stubbornly hold onto it, and don’t invent reasons.
If there’s a volume-backed breakout above 0.0007, then look toward the 0.0007412 area for the next resistance check—whether it can stand there will be the next judgment point.
All the conditions are laid out. Wait for the trigger—don’t run in early.
Let me say something not so nice: the active buy/sell ratio is only 0.75, and the buy side isn’t taking clear advantage. This rally looks more like shorts paying via funding rate and being forced to close, rather than a result of buyers actively attacking.
The参考盈亏比 (reward-to-risk ratio) is 0.6, which isn’t friendly by itself—meaning even if your directional call is right, the odds don’t clearly favor the longs.
The market won’t lie, but it also won’t stand in for you as a safety net. You have to measure risk yourself.
For reference only; this is not investment advice. Contracts involve leverage, investing is risky.
This article was assisted by the MasK xAI Grok AI model.
$VTHO
#Contract outlook