
ZECUSDT Enters a Critical Phase: Strong Rally, Rising On-Chain Activity, but Leverage Starts to Become a Risk
Zcash (ZEC) enters September 19, 2026 with a very interesting market structure. The price of ZEC has seen aggressive gains in the past few days, while network activity also shows a significant increase compared to the previous year. On the other hand, high open interest in the derivatives market means next week’s moves could remain highly volatile.
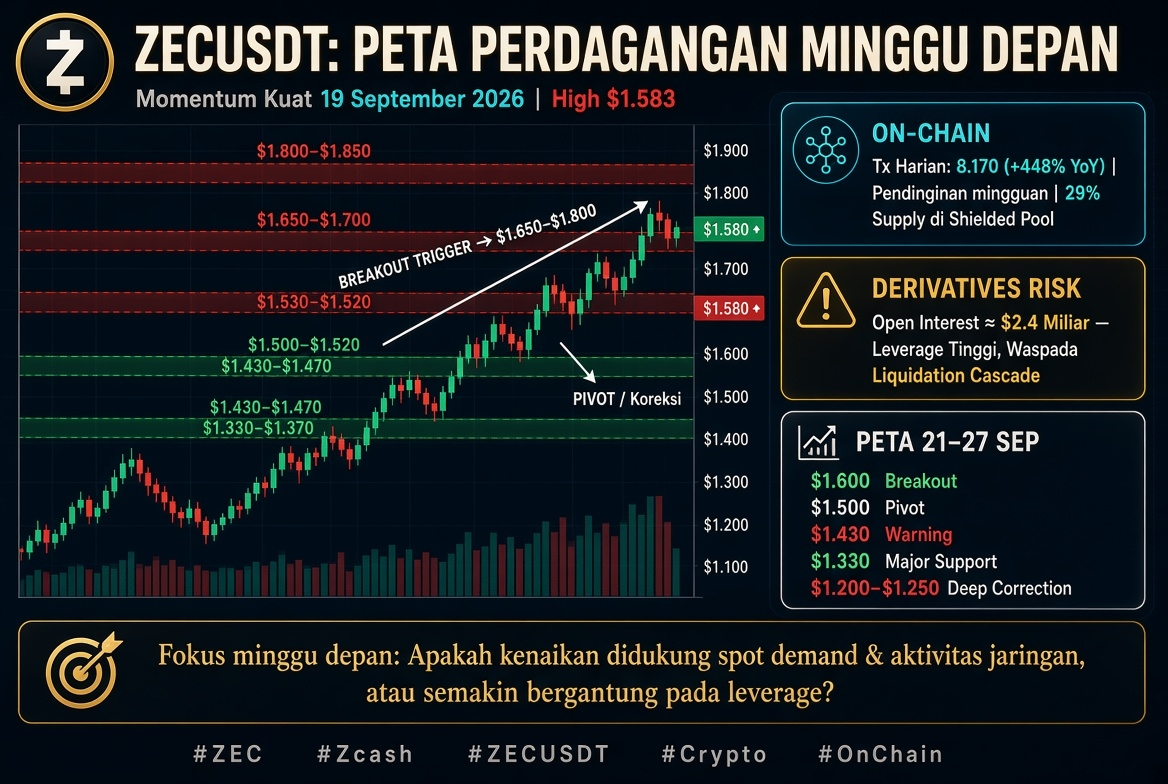
With the price hovering around the $1.530–$1.550 area, the market is now caught between two likely outcomes: continuing a bullish expansion if it can break through resistance at $1.580–$1.600, or entering a correction phase if buyers fail to hold the main support area.
ZEC Rally Gets More Aggressive
The price movement over the past few days shows strong momentum.
ZEC moved from about $1,110 on September 15 to about $1,337 on September 16, then rose to $1,467 on September 17 and reached around $1,562 on September 18.
The latest high is around $1,583.
This means that in a relatively short time, ZEC has shifted from the $1,100 area to above $1,500. Moves like this indicate the market is assigning a much higher valuation to ZEC, but at the same time increasing the risk of profit-taking and liquidation if momentum starts to lose steam.
Therefore, the $1,600 level is one of the most important points to watch next week.
$1,600 Becomes the Gateway to the Next Move
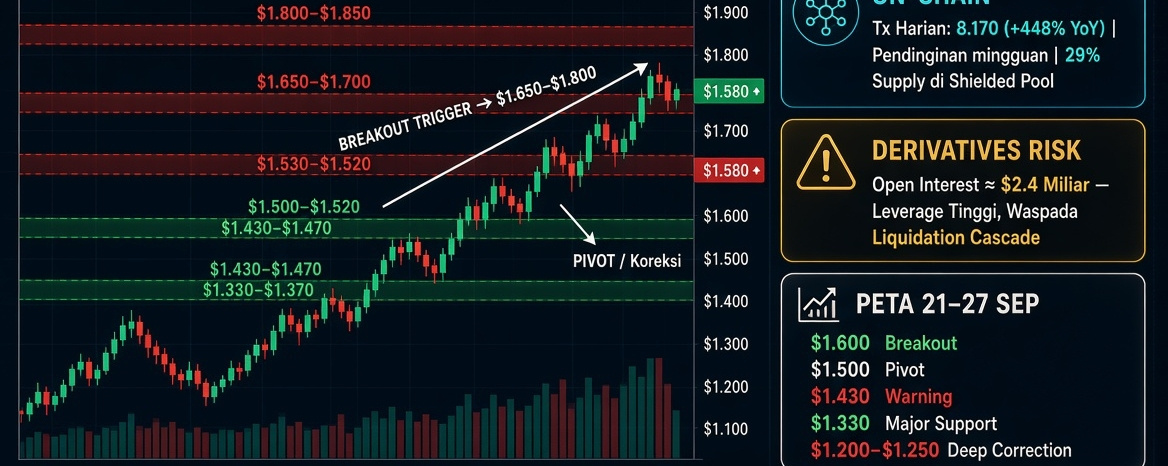
The $1,580–$1,600 area is the main short-term resistance.
If ZEC is able to break above $1,600 and maintain that level through a 4H candle or daily close, the market can enter the next expansion phase.
The zone that then needs to be watched is:
$1,650–$1,700 as the next resistance.
If momentum remains very strong, the $1,800–$1,850 area could become an extension zone.
However, the breakout should not be judged based on price alone.
A healthier breakout will be visible when price rises along with an increase in spot volume, while open interest does not spike too extremely.
Conversely, if price rises very quickly but most of the rise comes from leverage, the risk of a false breakout and a liquidation cascade will increase.
Support That Becomes a Risk Map
If ZEC fails to break above $1,600, the first focus shifts to the $1,500–$1,520 area.
That area can become a short-term psychological pivot.
If a pullback occurs but price is able to hold above that zone, the bullish structure is still relatively intact.
The next support is around $1,430–$1,470.
This zone becomes important because it is adjacent to the previous breakout area. The reaction from buyers here can indicate whether the correction is only a retracement or has started to turn into a trend reversal.
Below it, there is structural support at $1,330–$1,370.
Losing this zone will be a sign that the short-term bullish structure is facing more serious pressure.
If $1,330 also fails to hold, attention may shift to the $1,200–$1,250 area.
On-Chain Data Shows Interesting Changes
What makes this ZEC rally interesting is an increase in network activity compared to the previous year.
ZecStats data as of September 17 shows about 8,170 transactions per day and a shielded transaction share of around 51.27%.
Compared to the same period the previous year, daily transactions increased by about 448%, while transparent volume increased by about 359%.
This shows that increased attention to Zcash is not only happening in the trading market, but is also reflected in network activity.
But there is another side that needs to be considered.
In the short-term comparison, daily transactions fell from about 10,897 to 8,170, while new transparent addresses fell from about 3,934 to 2,516.
The shielded transaction share also fell from about 56.66% to 51.27%.
Thus, there are two stories running in parallel.
On a yearly basis, Zcash network activity has grown enormously.
However, over the weekly timeframe, several activity indicators have started to cool off.
This difference matters because price continuing to rise while short-term network activity declines can be a sign that market momentum is increasingly dependent on capital flows and leverage.
Shielded Supply Becomes a Unique Factor for ZEC
Around 29% of the ZEC supply is in a shielded pool.
This characteristic makes on-chain analysis for Zcash slightly different from Bitcoin or other fully transparent blockchains.
Not all supply movements can be observed through public addresses with the same level of transparency.
Therefore, whale data and exchange flow data derived from transparent blockchains need to be read carefully.
Shifting supply into shielded pools can make some ZEC holders’ activity not directly visible in transparent address data.
This is one of the reasons why ZEC analysis should combine price data, derivatives, and network metrics at the same time.
Biggest Risk Next Week: Leverage
One of the most important factors is the derivatives market.
Perpetual ZEC open interest briefly reached around $2.4 billion when price saw a big rally.
These numbers indicate that leverage has become an important part of ZEC’s price discovery.
The conditions can create a chain effect.
If price rises, short liquidation can push price even higher.
However, if price drops, long liquidation can accelerate the decline.
Therefore, an increase in open interest does not always mean bullish.
What matters more is how open interest moves compared to price, spot volume, and the funding rate.
Three Scenarios for Sept 21–27
First scenario: Breakout
If ZEC successfully breaks through and holds $1,600, attention can shift toward:
$1,650 → $1,700 → $1,800.
Stronger confirmation will come if the breakout is accompanied by increasing spot volume and OI remains under control.
A more conservative strategy is to wait for the breakout, then see whether $1,580–$1,600 turns into support via a retest.
Second scenario: Healthy pullback
If ZEC fails to break above $1,600 and performs a correction toward $1,500–$1,520, that area becomes an important pivot.
If buyers step back in and price forms a higher-low structure, the bullish trend still has room to continue.
If the correction goes deeper, the $1,430–$1,470 area becomes the next observation zone.
Third scenario: Breakdown
If $1,430 loses support decisively, selling pressure could increase.
Attention then shifts to $1,370–$1,330.
Losing $1,330 would be a more serious structural change and would open up the possibility of testing the $1,200–$1,250 area.
ZEC Dashboard to Monitor
To read ZEC’s direction next week, price alone is not enough.
Some indicators that need to be monitored simultaneously are:
Price above $1,600 → breakout momentum.
Price holds at $1,500 → the short-term bullish structure is still intact.
Price loses $1,430 → correction risk increases.
OI rises moderately → healthier than extreme spikes.
Funding is too positive → risk of being long crowded increases.
Exchange inflow increases → need to watch for potential selling pressure.
Network transactions increase → supports fundamental activity.
Shielded activity stabilizes or increases → supports network usage.
Conclusion
ZEC enters next week with a very strong structure, but also has a high level of risk.
On one hand, price has seen a big rally and Zcash’s network activity on a yearly basis shows significant growth.
On the other hand, short-term on-chain activity has begun to cool off, and derivative open interest is at a level that makes the market more sensitive to liquidation.
Therefore, the $1,600 level is an important point to determine whether the market is entering a new expansion phase or instead needs a correction first.
The main map for next week:
$1,600 → trigger breakout
$1,500–$1,520 → pivot
$1,430–$1,470 → demand zone
$1,330–$1,370 → major support
$1,200–$1,250 → deeper correction zone
If a breakout happens, the $1,650–$1,700 area becomes the next zone to watch, while $1,800–$1,850 is a more aggressive expansion area.
However, if a correction occurs, the price reaction at $1,500 and especially $1,430–$1,470 will provide important information about the strength of buyers.
The most important conclusion is not whether ZEC must go up or down, but that next week is likely to be a confirmation phase: whether ZEC’s rally can gain fresh support from spot and network activity, or whether it becomes even more dependent on leverage.
For traders, the combination of price + volume + open interest + funding + exchange flow + on-chain activity will be a much more useful map than relying on just one indicator.
This analysis is mapping market scenarios based on available data and is not a guarantee of price movement or an invitation to open positions.