

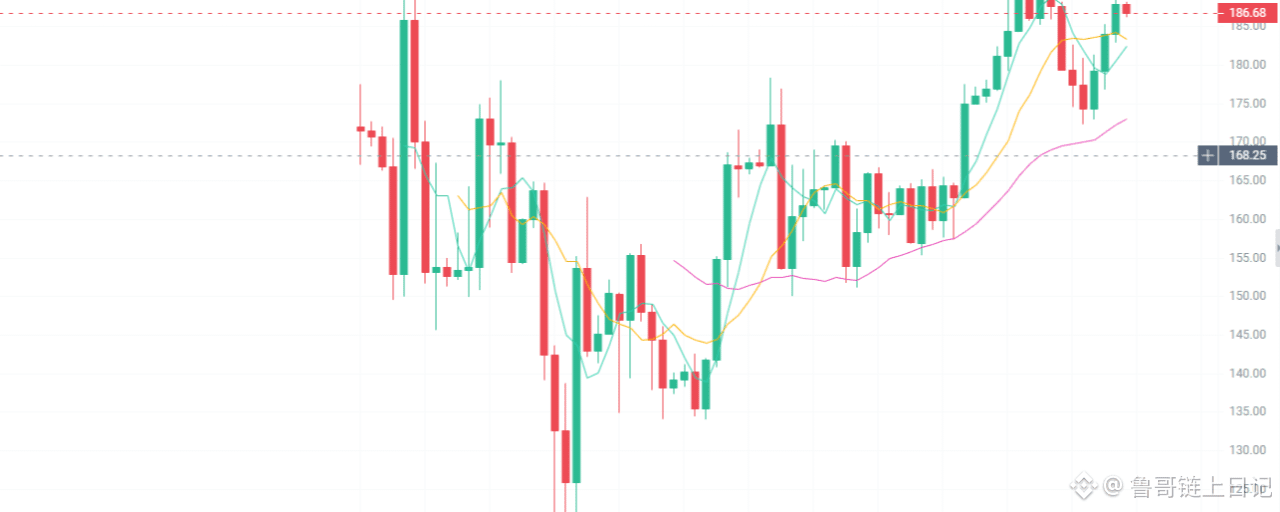

On September 19, $SKHY current price 186.71. Based on the candlestick chart, SKHY has gone through a round of rapid rallies in the recent period. The price rebounded from around $170 all the way to around $190, and the short-term upside has clearly expanded.
Latest market data shows that on September 18 SKHY closed at $187.50. Intraday, it peaked at $192.01, but there was a clear struggle and fluctuation at the high level. Meanwhile, although the technical indicators remain generally bullish—RSI around 62—the stochastic indicators, StochRSI, and CCI have already flashed high-level signals.
So the focus today isn’t simply to judge a trend reversal, but to see whether, after the high-level impulse into the $192–$193 range, it can continue with an upswing and break higher with increased volume. If the breakout fails, the pullback potential caused by profit-taking by short-term positions is worth watching.
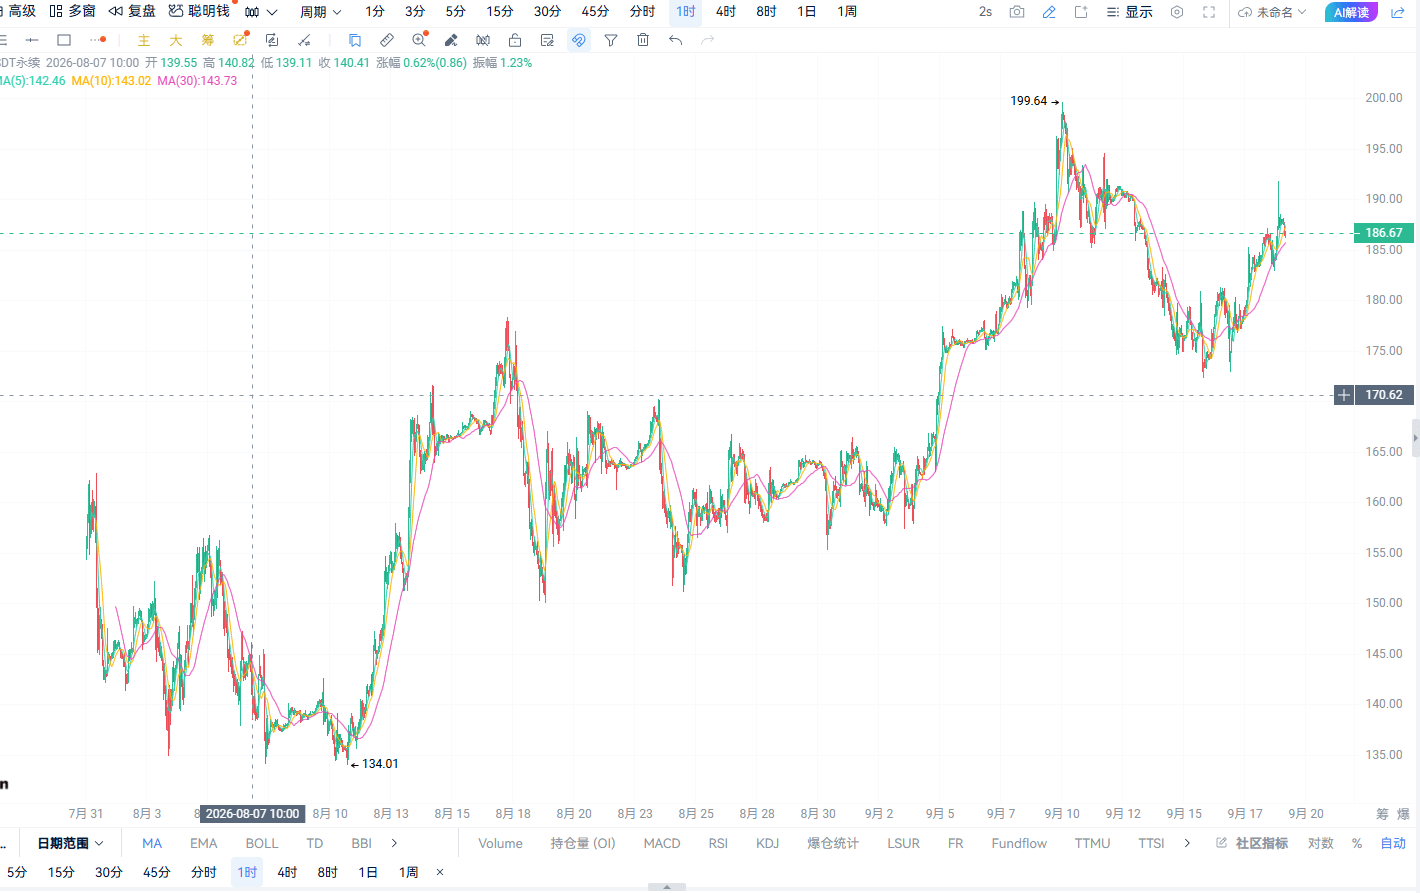
On the 1-hour chart, there is a stall at high levels, and short-term bears have started to take the initiative
From the 1-hour candlesticks, SKHY’s recent upward pace has clearly accelerated, and the price has been continuously trading in the high-level zone.
However, after the push above $190, the order book started showing clear divergence between bulls and bears. In the latest 1-hour formation, there are already bearish signals such as bearish engulfing and an Advance Block. This indicates that the momentum of buyers pushing prices higher is weakening.
Around $186—$187 is an important area to watch for the short term.
If the price rebounds but still cannot regain $190, and it breaks below $186, then the short-cycle structure is likely to gradually shift from high-level consolidation to a pullback.
First focus below around $184; further look at the $182—$183 zone.
4-hour line: the trend is still strong, but the demand for technical correction after the rally is increasing
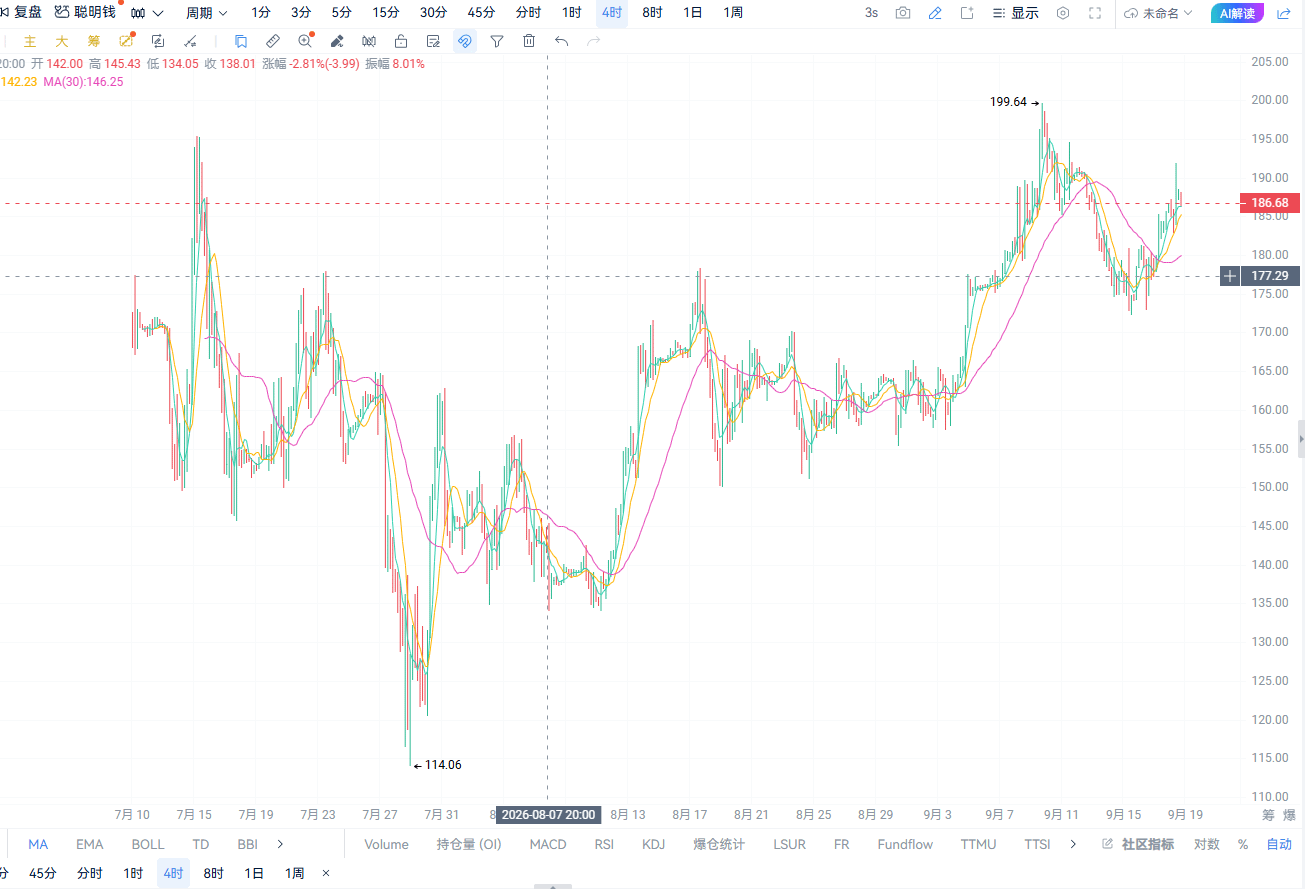
On the 4-hour timeframe, SKHY previously rebounded quickly from around $170 and has consecutively broken through multiple resistance levels. The current price has already moved into a densely concentrated area near the prior highs.
The moving-average system is still biased bullish, indicating that the intermediate-term trend has not fully weakened yet. In the latest technical data, MA5, MA10, MA20, and MA50 are all below the price, and the overall moving-average structure still maintains a bullish formation.
But here you need to pay special attention to:
A strong trend doesn’t mean prices can’t fall in the short term.
After a series of continuous gains, if the price cannot effectively break through near $190, and volume can’t keep up, then a round of technical pullback is very likely.
Key focus on the 4-hour timeframe:
Resistance above: $190—$193
Support below: $184—$185
If it breaks below $184, further watch the area around $182.
Daily: the higher-level trend is relatively strong; resistance at high levels will determine the rhythm of the next phase
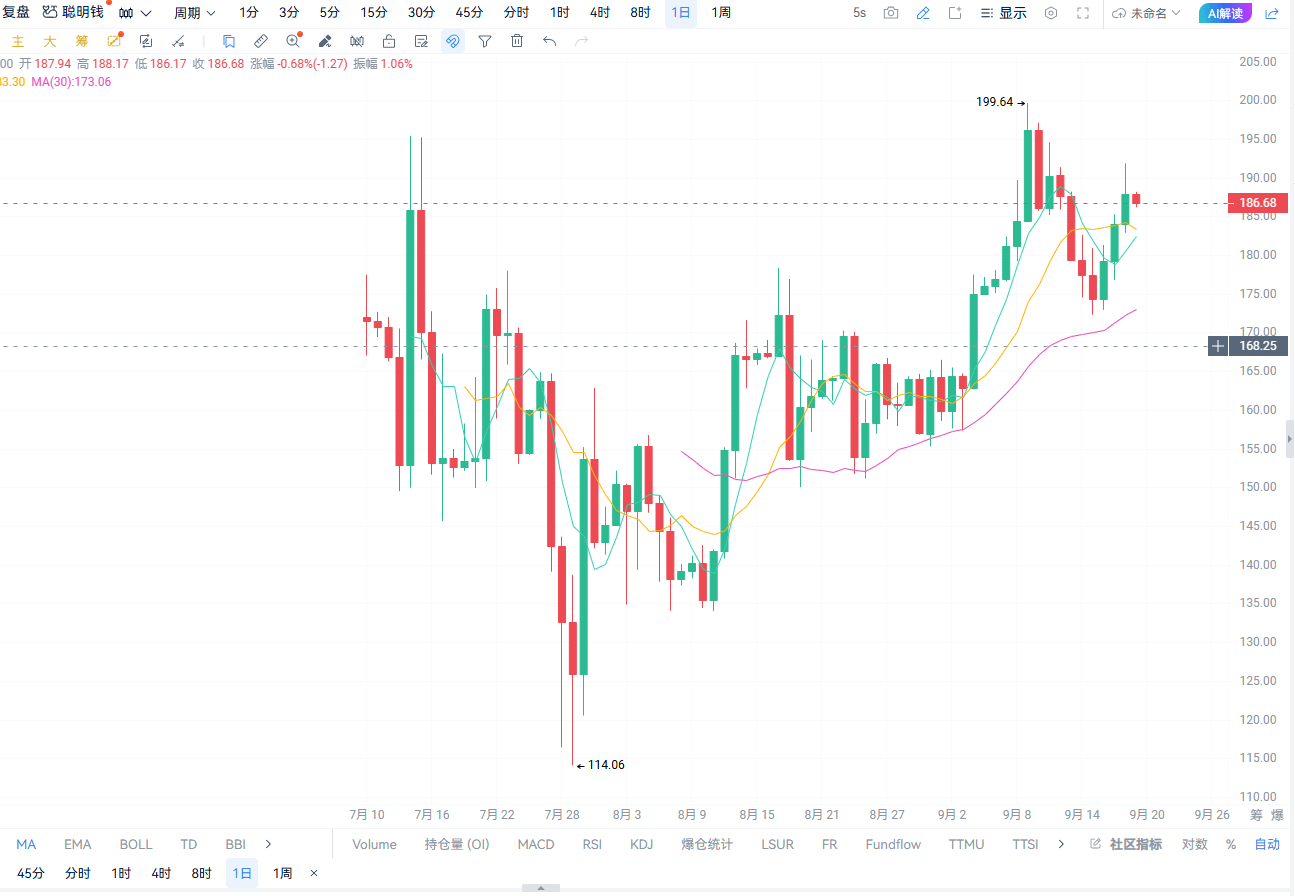
From the daily chart, SKHY’s recent走势 still belongs to a bullish repair structure.
On Sep 17 it rose 4.64%, and on Sep 18 it continued up 2.47%. But on Sep 18, after the intraday high reached $192.01, it pulled back, indicating there is already some selling pressure above $190.
From technical indicators, MACD, ADX, and the moving-average system are still biased bullish, suggesting the daily trend cannot be simply defined as a reversal for now. However, StochRSI has reached 100, and CCI is also clearly in a high zone, meaning there is strong short-term technical cooling demand.
So what the daily chart truly needs to watch is:
Can it effectively break through $190—$193 and hold?
If it can break out with increased volume, the short-side thesis needs to be avoided in time. If multiple attempts fail and the price then falls below short-term support, the pullback space after this up move may gradually open up.
Key levels today
Resistance above: $190—$193
First support: $184—$185
Second support: $182—$183
Strength/weakness dividing line: around $180
Taking the 1-hour, 4-hour, and daily charts together, SKHY is currently showing a rather typical structure: strong on the larger cycle, with resistance pressure on the short cycle at high levels.
Therefore, today’s key focus is the breakout near $190. If it keeps pushing higher but cannot hold, and there is a volume-increasing pullback in the short term, then bears can look to one pullback in line with the short-cycle rhythm.
You don’t fear market oscillations; what you fear is trading without a plan. Shorting at high levels requires even tighter risk control. Once it breaks key resistance, don’t fight the trend with it.
Live trade | SKHY short at current price
Entry price: 186.71
Direction: short
Stop-loss: 189.51
First take-profit: 184.84
Second take-profit: 182.98
Key focus: watch for pressure around $190. If the price continues to fall below $186, pay special attention to the $184—$185 support zone. If it breaks upward and holds above the key resistance, strictly execute the stop-loss.