Set up short-term LAB: the levels I'm monitoring
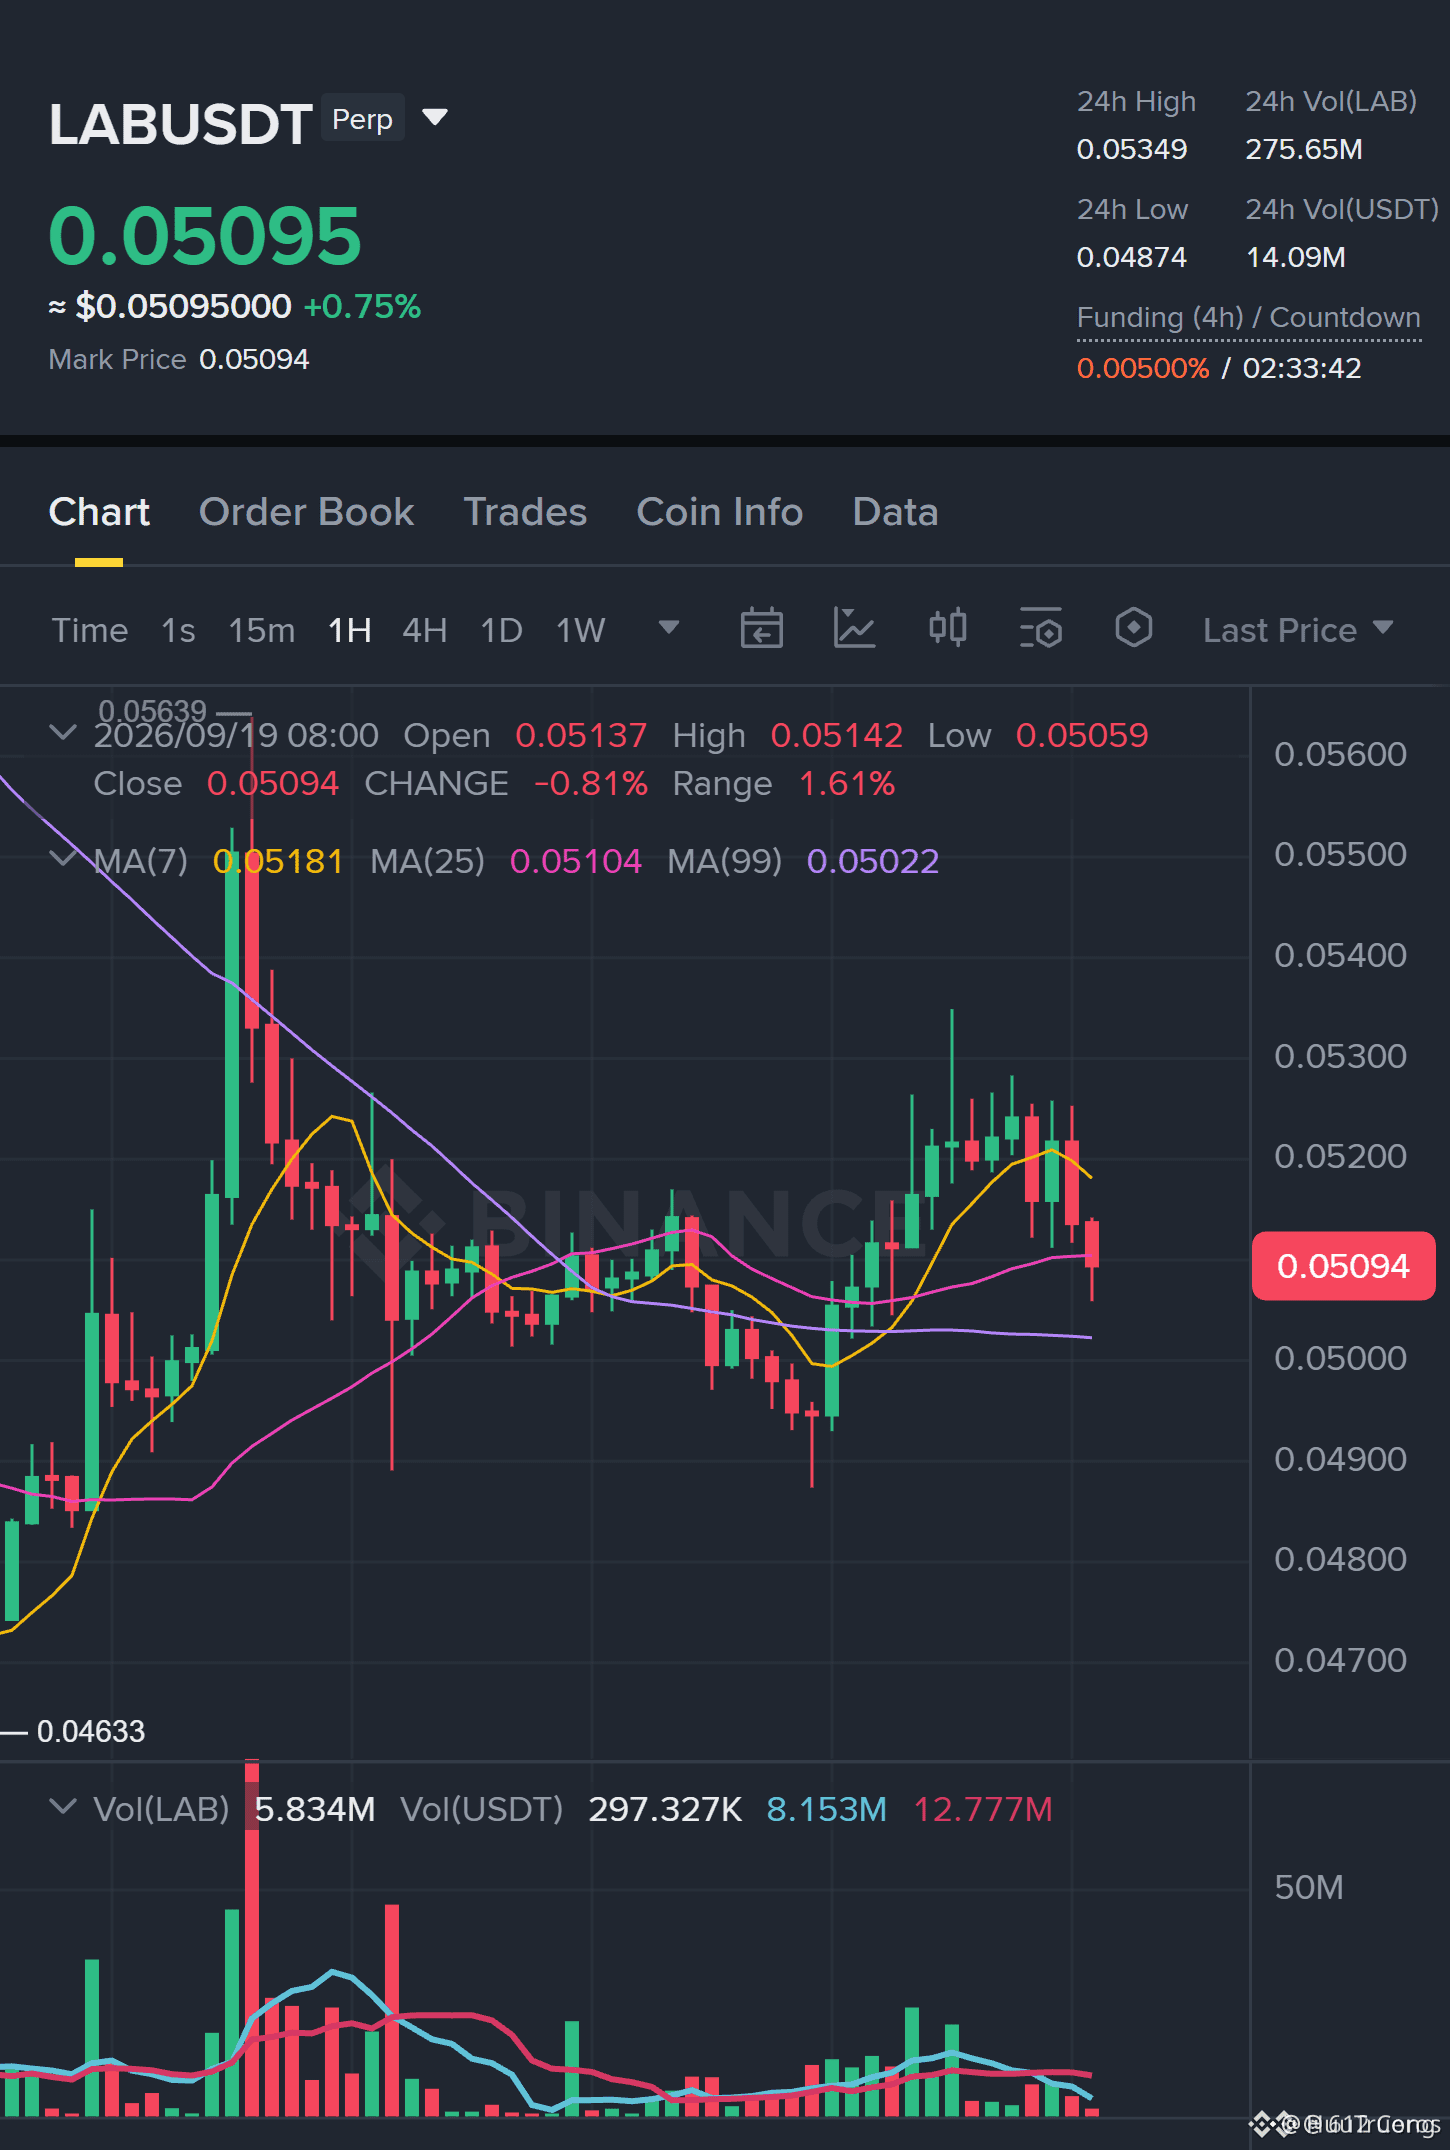
📊 $LAB /USDT · Trend: SHORT (Strong) · 6/12 consensus signals
Technical conclusion: STRONG SHORT. 6/12 consensus signals, 0 opposing signals.
✅ Daily trend: price < EMA50 < EMA200, bearish stack
✅ 4h trend: price < EMA50 < EMA200, bearish stack
✅ 1h trend: price < EMA50 < EMA200, bearish stack
✅ Trend strength (ADX/DI, 15m): ADX 25.3, sellers in control (DI+ 21.0 vs DI− 28.3)
✅ Short-term momentum (15m): RSI z-score −2.93, latest candle −0.82%, sellers are pushing
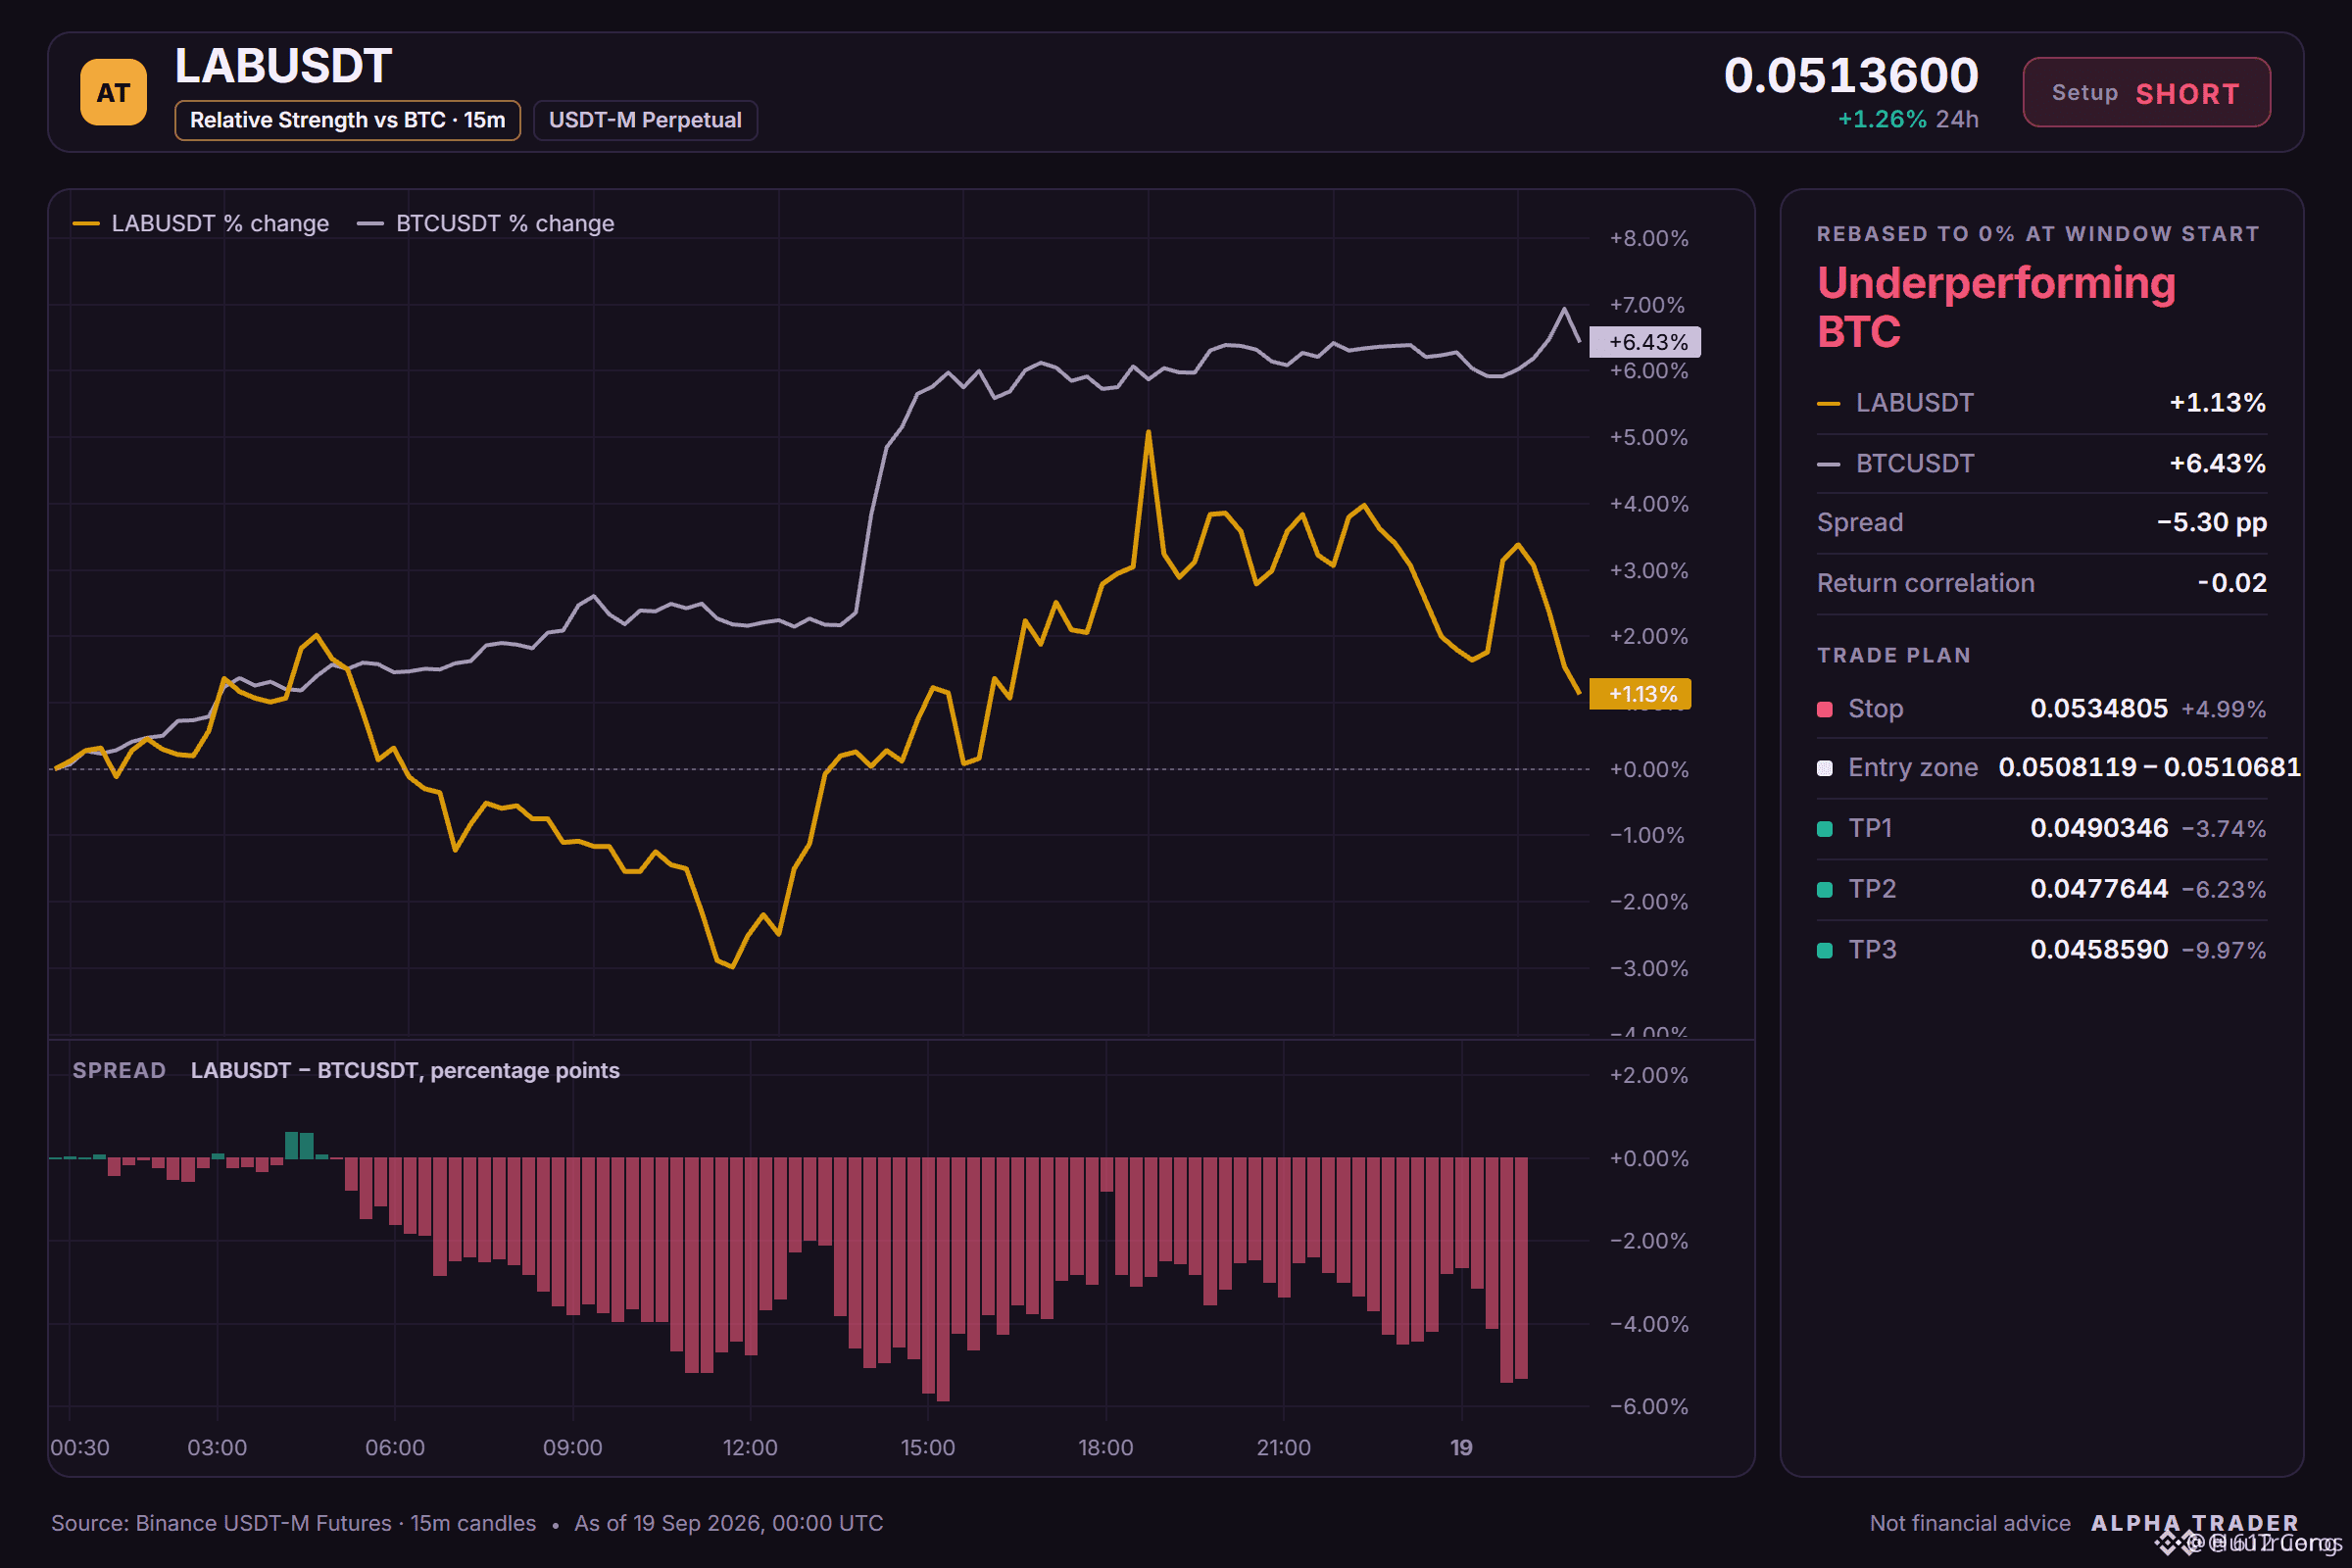
✅ Relative strength vs BTC: underperforming, −4.88% vs BTC over the past 1 day
No factors are currently going in the opposite direction.
Trading plan:
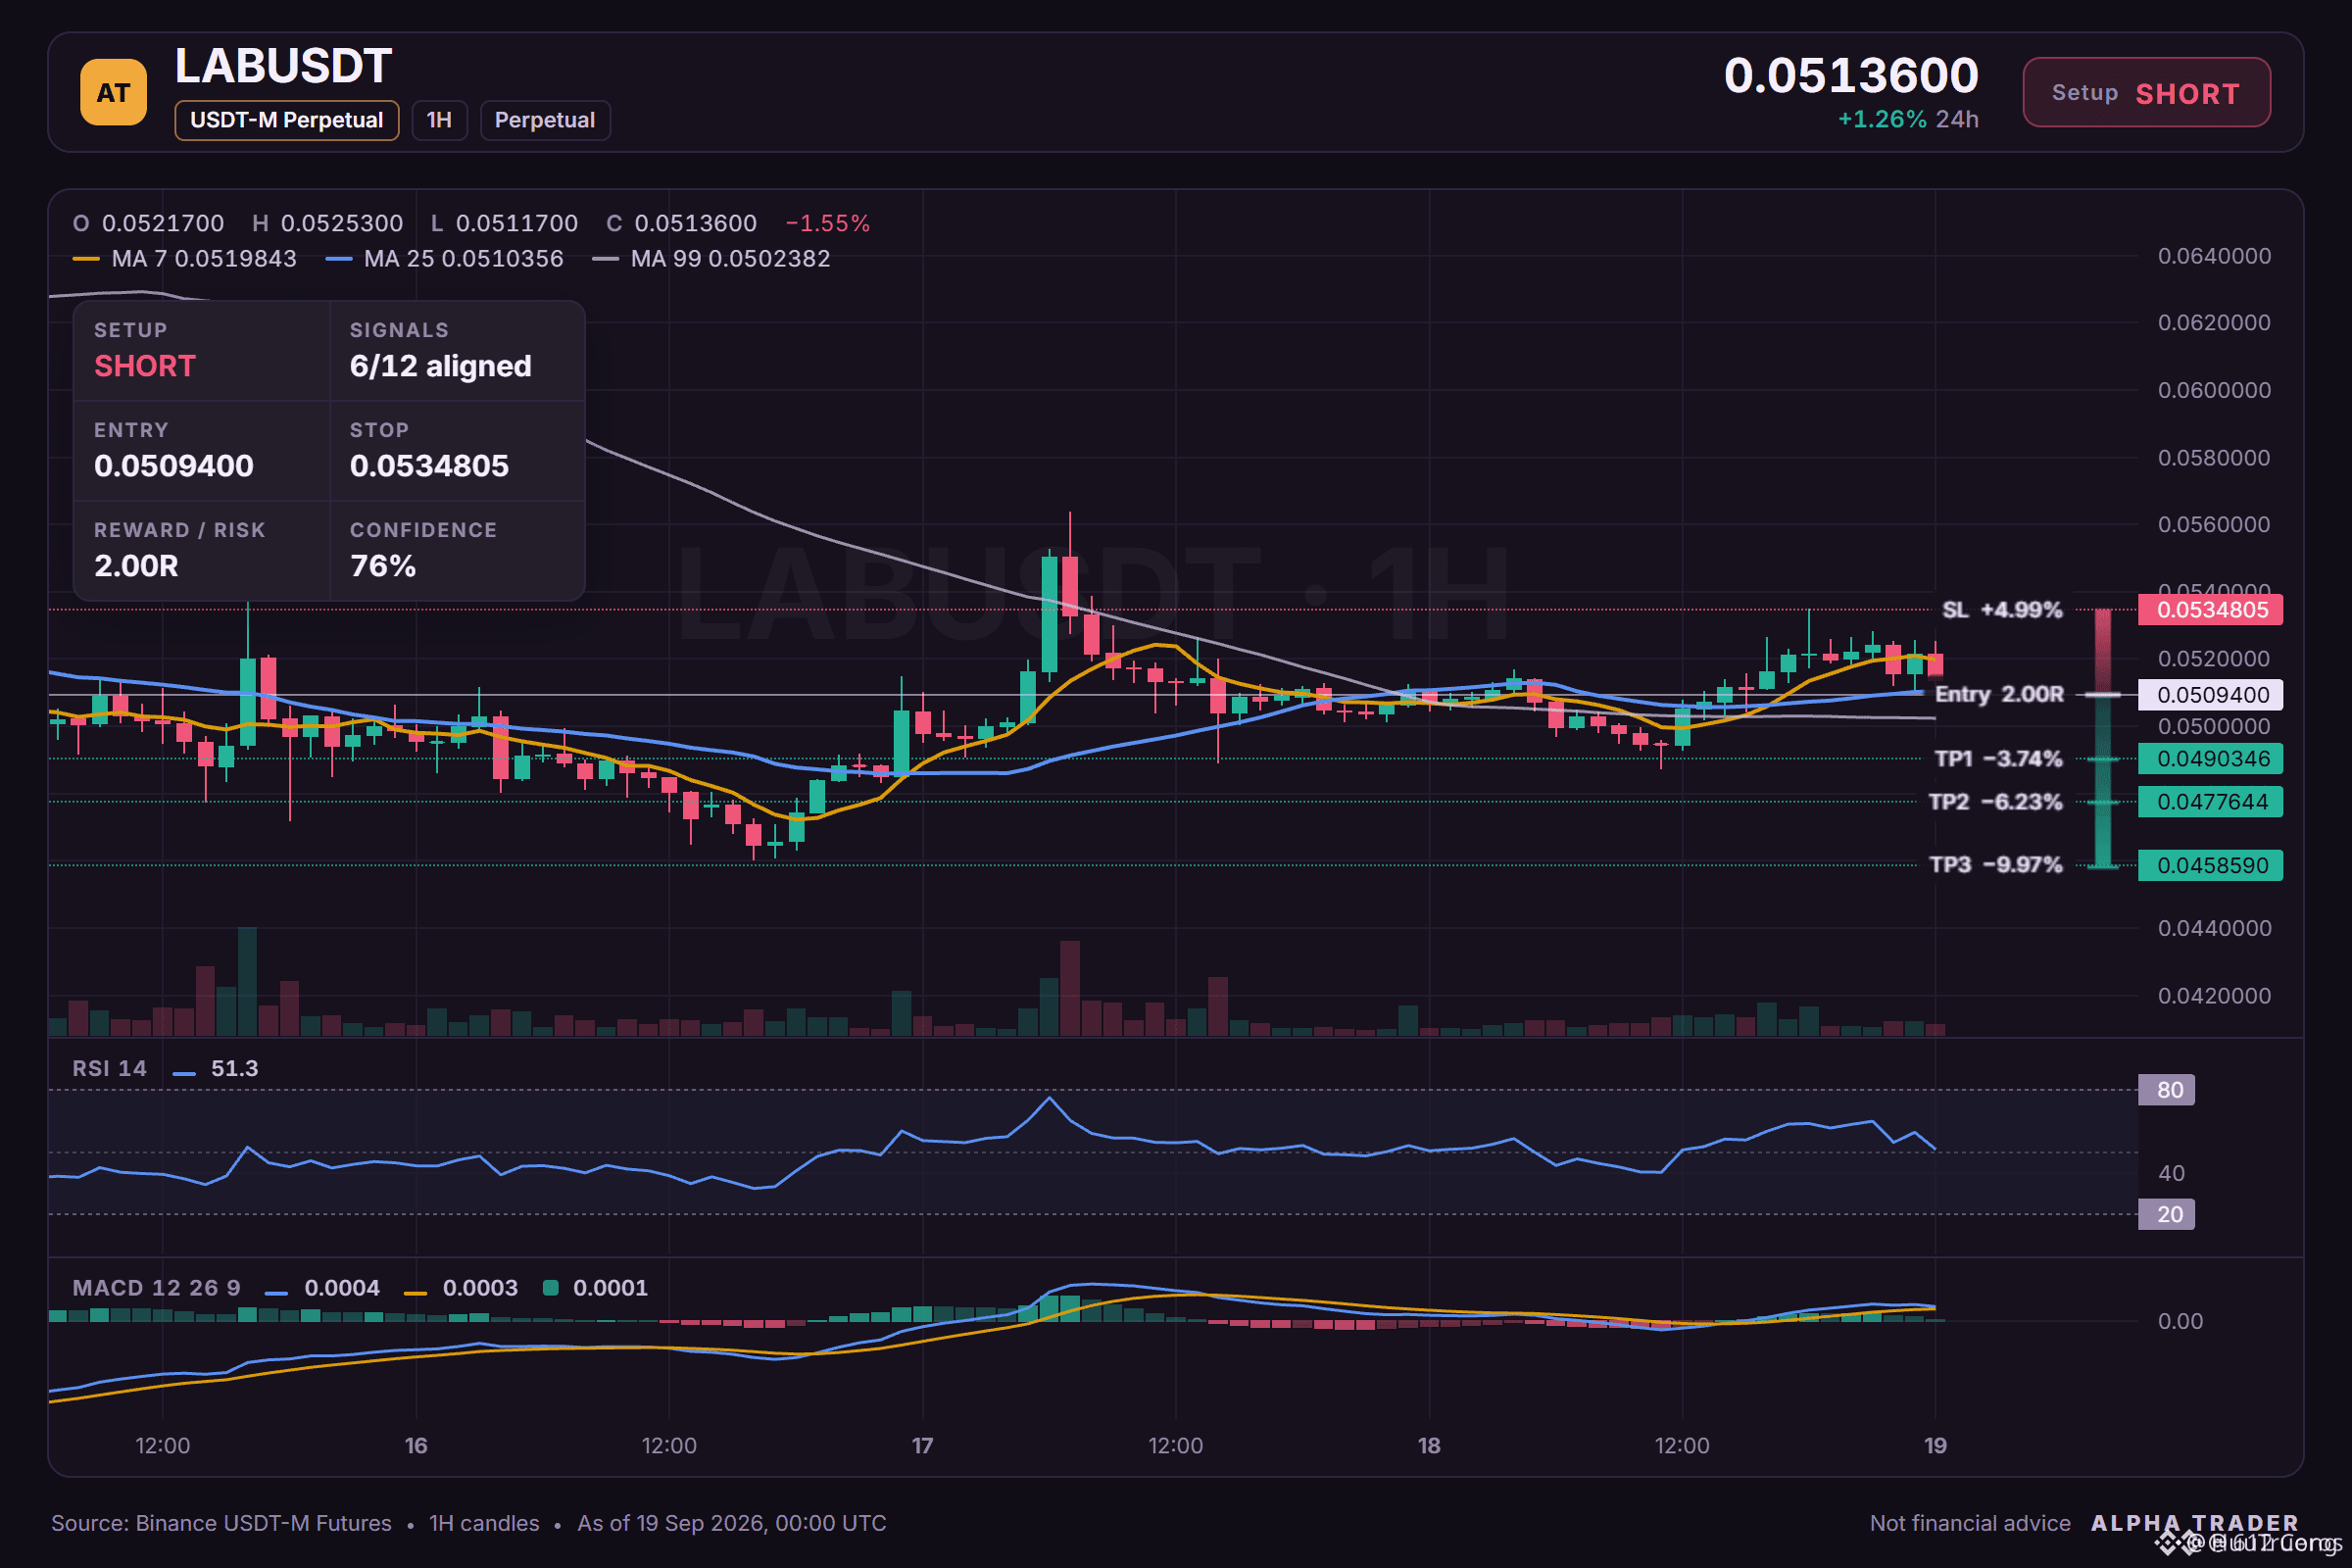
Entry: 0.0508119 – 0.0510681
SL: 0.0534805
TP1: 0.0490346
TP2: 0.0477644
TP3: 0.0458590
Rationale:
The daily trend is bearish, and 6/12 signals support the short side. The plan is to work within 0.0508119 – 0.0510681, take profit gradually at 0.0490346 and 0.0477644, and wait patiently for the target 0.0458590. If price breaks above 0.0534805, the idea is wrong and the stop-loss will do its job.
Discussion:
Will LAB reach 0.0490346 first, or will it hit the stop?
Chart with all levels 👇
⚠️ Individual market analysis only. NFA — manage risk and DYOR.
Educational content only; not investment advice or any recommendation to buy, sell, deposit, or withdraw any assets. No paid promotion or referral/affiliate links.
📊 $LAB /USDT · Trend: SHORT (Strong) · 6/12 consensus signals
Technical conclusion: STRONG SHORT. 6/12 consensus signals, 0 opposing signals.
✅ Daily trend: price < EMA50 < EMA200, bearish stack
✅ 4h trend: price < EMA50 < EMA200, bearish stack
✅ 1h trend: price < EMA50 < EMA200, bearish stack
✅ Trend strength (ADX/DI, 15m): ADX 25.3, sellers in control (DI+ 21.0 vs DI− 28.3)
✅ Short-term momentum (15m): RSI z-score −2.93, latest candle −0.82%, sellers are pushing
✅ Relative strength vs BTC: underperforming, −4.88% vs BTC over the past 1 day
No factors are currently going in the opposite direction.
Trading plan:
Entry: 0.0508119 – 0.0510681
SL: 0.0534805
TP1: 0.0490346
TP2: 0.0477644
TP3: 0.0458590
Rationale:
The daily trend is bearish, and 6/12 signals support the short side. The plan is to work within 0.0508119 – 0.0510681, take profit gradually at 0.0490346 and 0.0477644, and wait patiently for the target 0.0458590. If price breaks above 0.0534805, the idea is wrong and the stop-loss will do its job.
Discussion:
Will LAB reach 0.0490346 first, or will it hit the stop?
Chart with all levels 👇
⚠️ Individual market analysis only. NFA — manage risk and DYOR.
Educational content only; not investment advice or any recommendation to buy, sell, deposit, or withdraw any assets. No paid promotion or referral/affiliate links.