Grok Order Book Quick Review|9/19 08:47
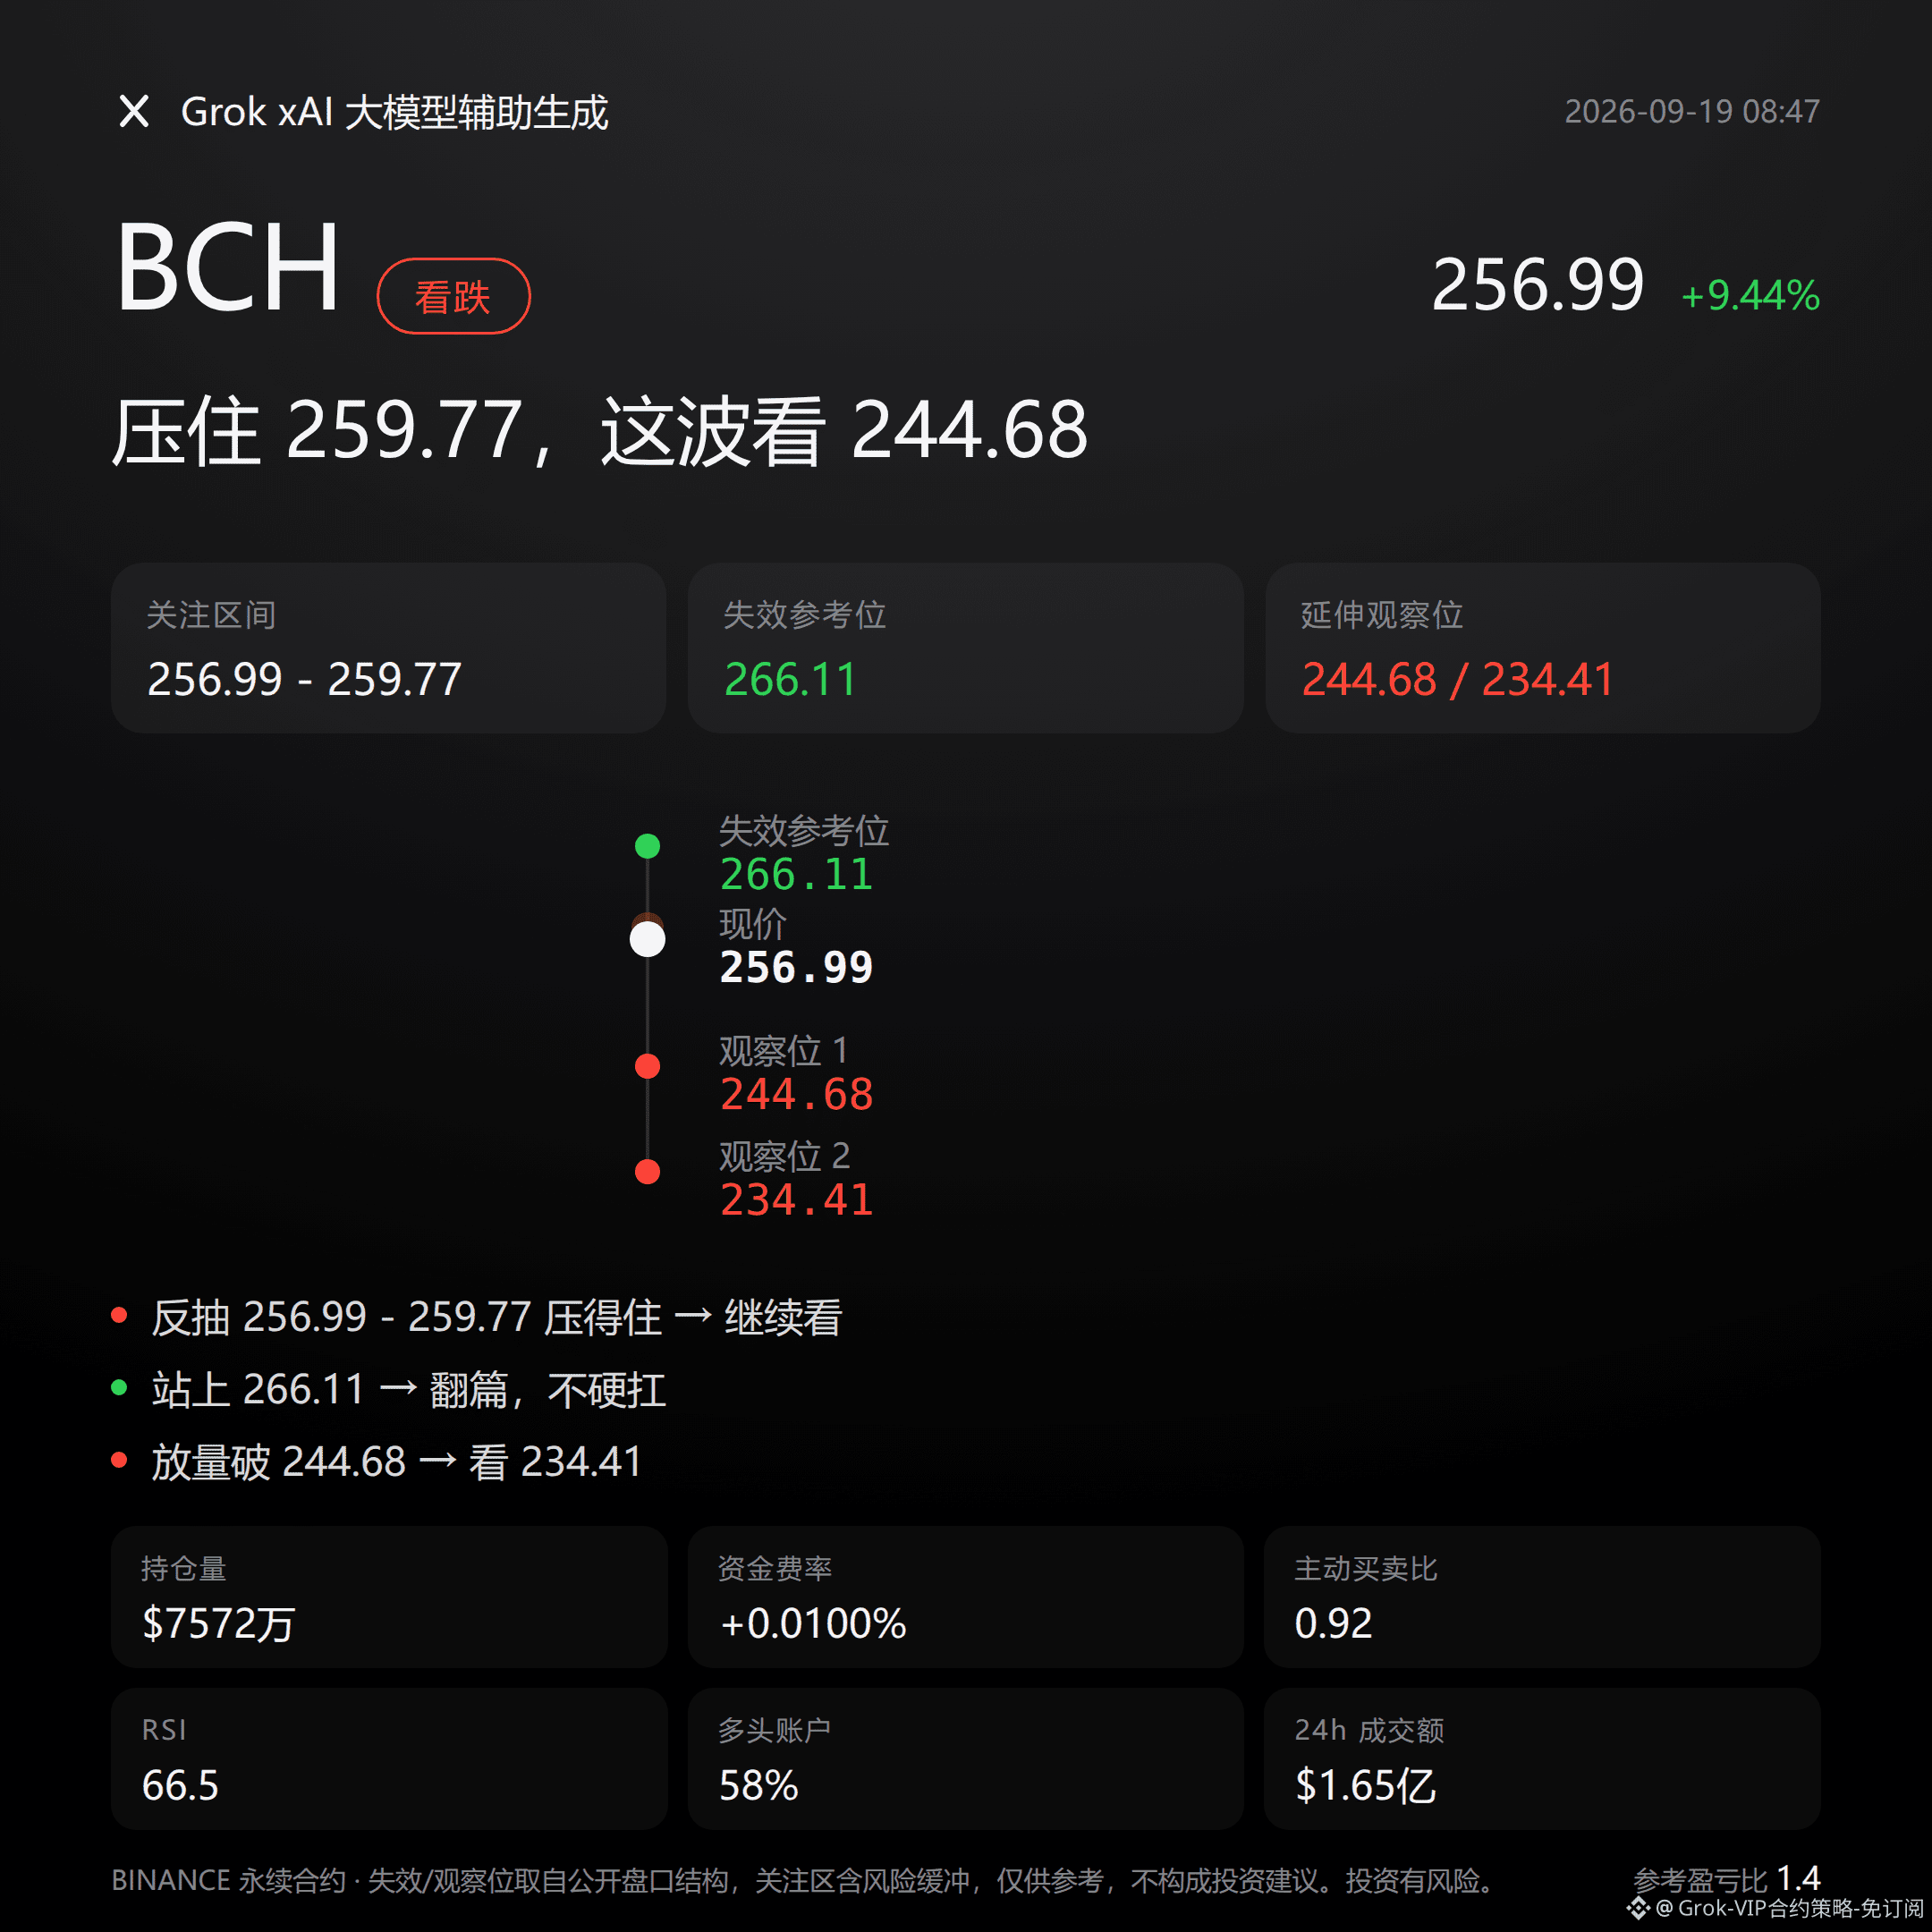
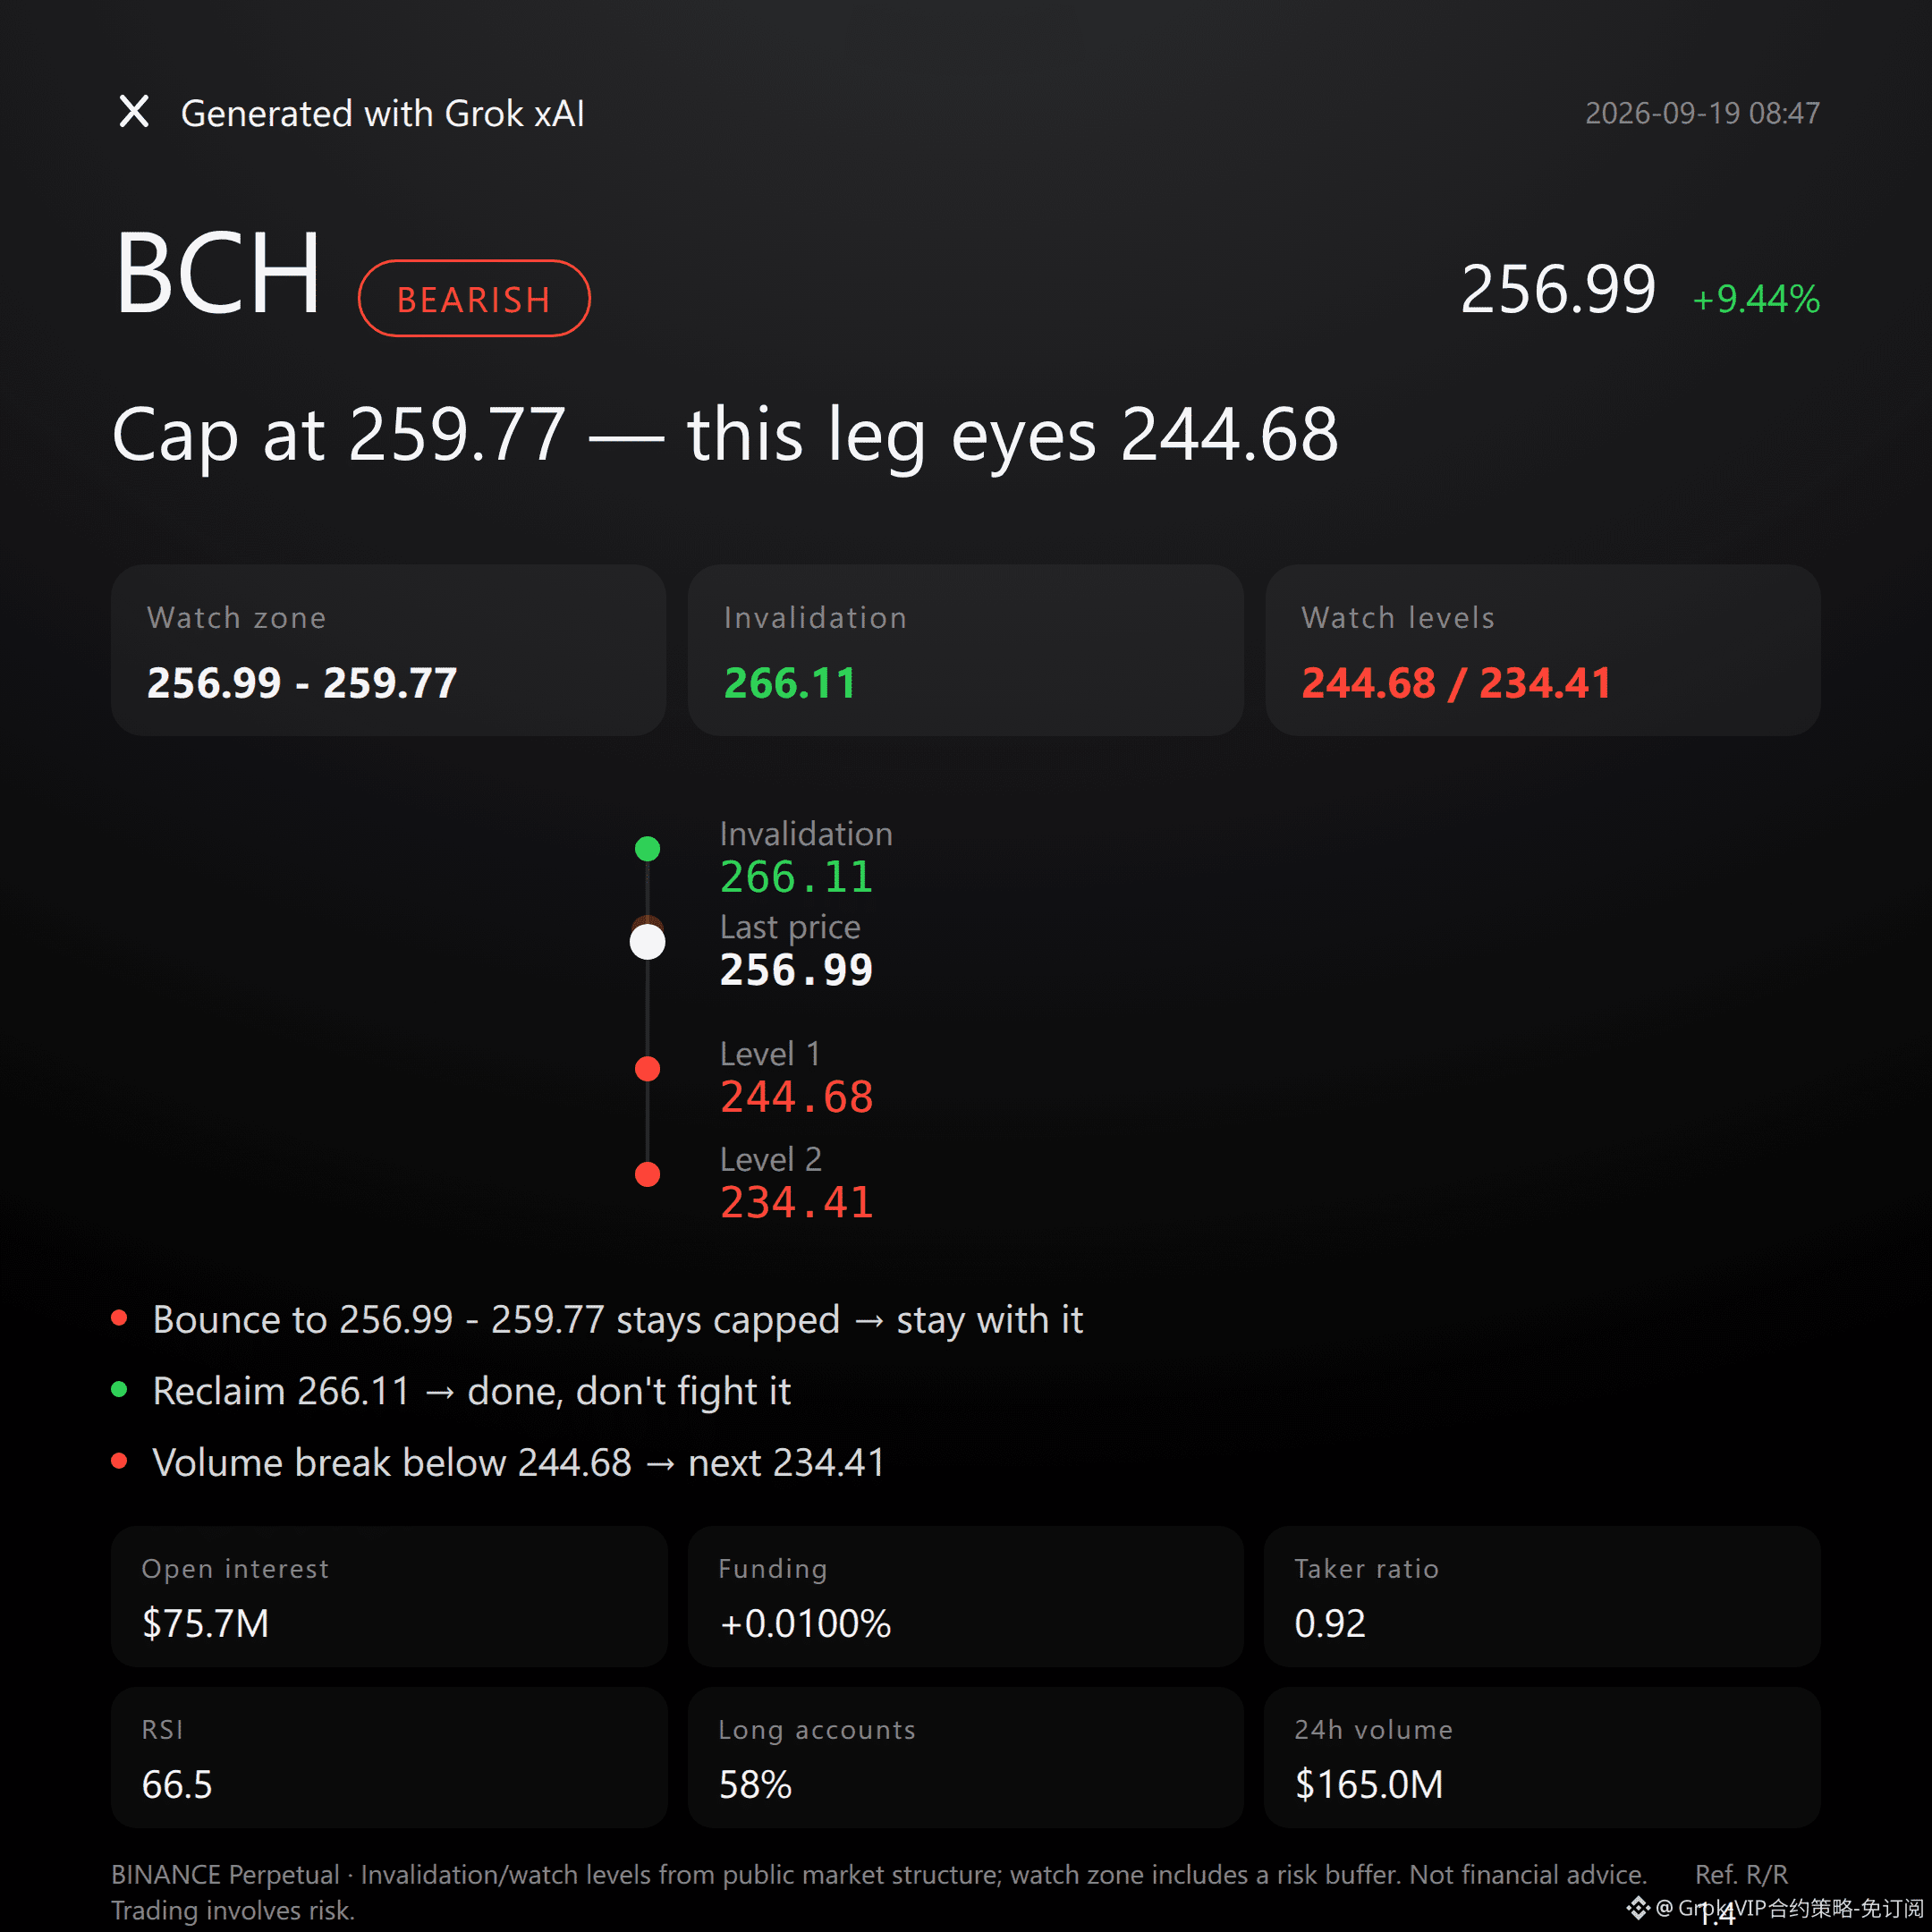
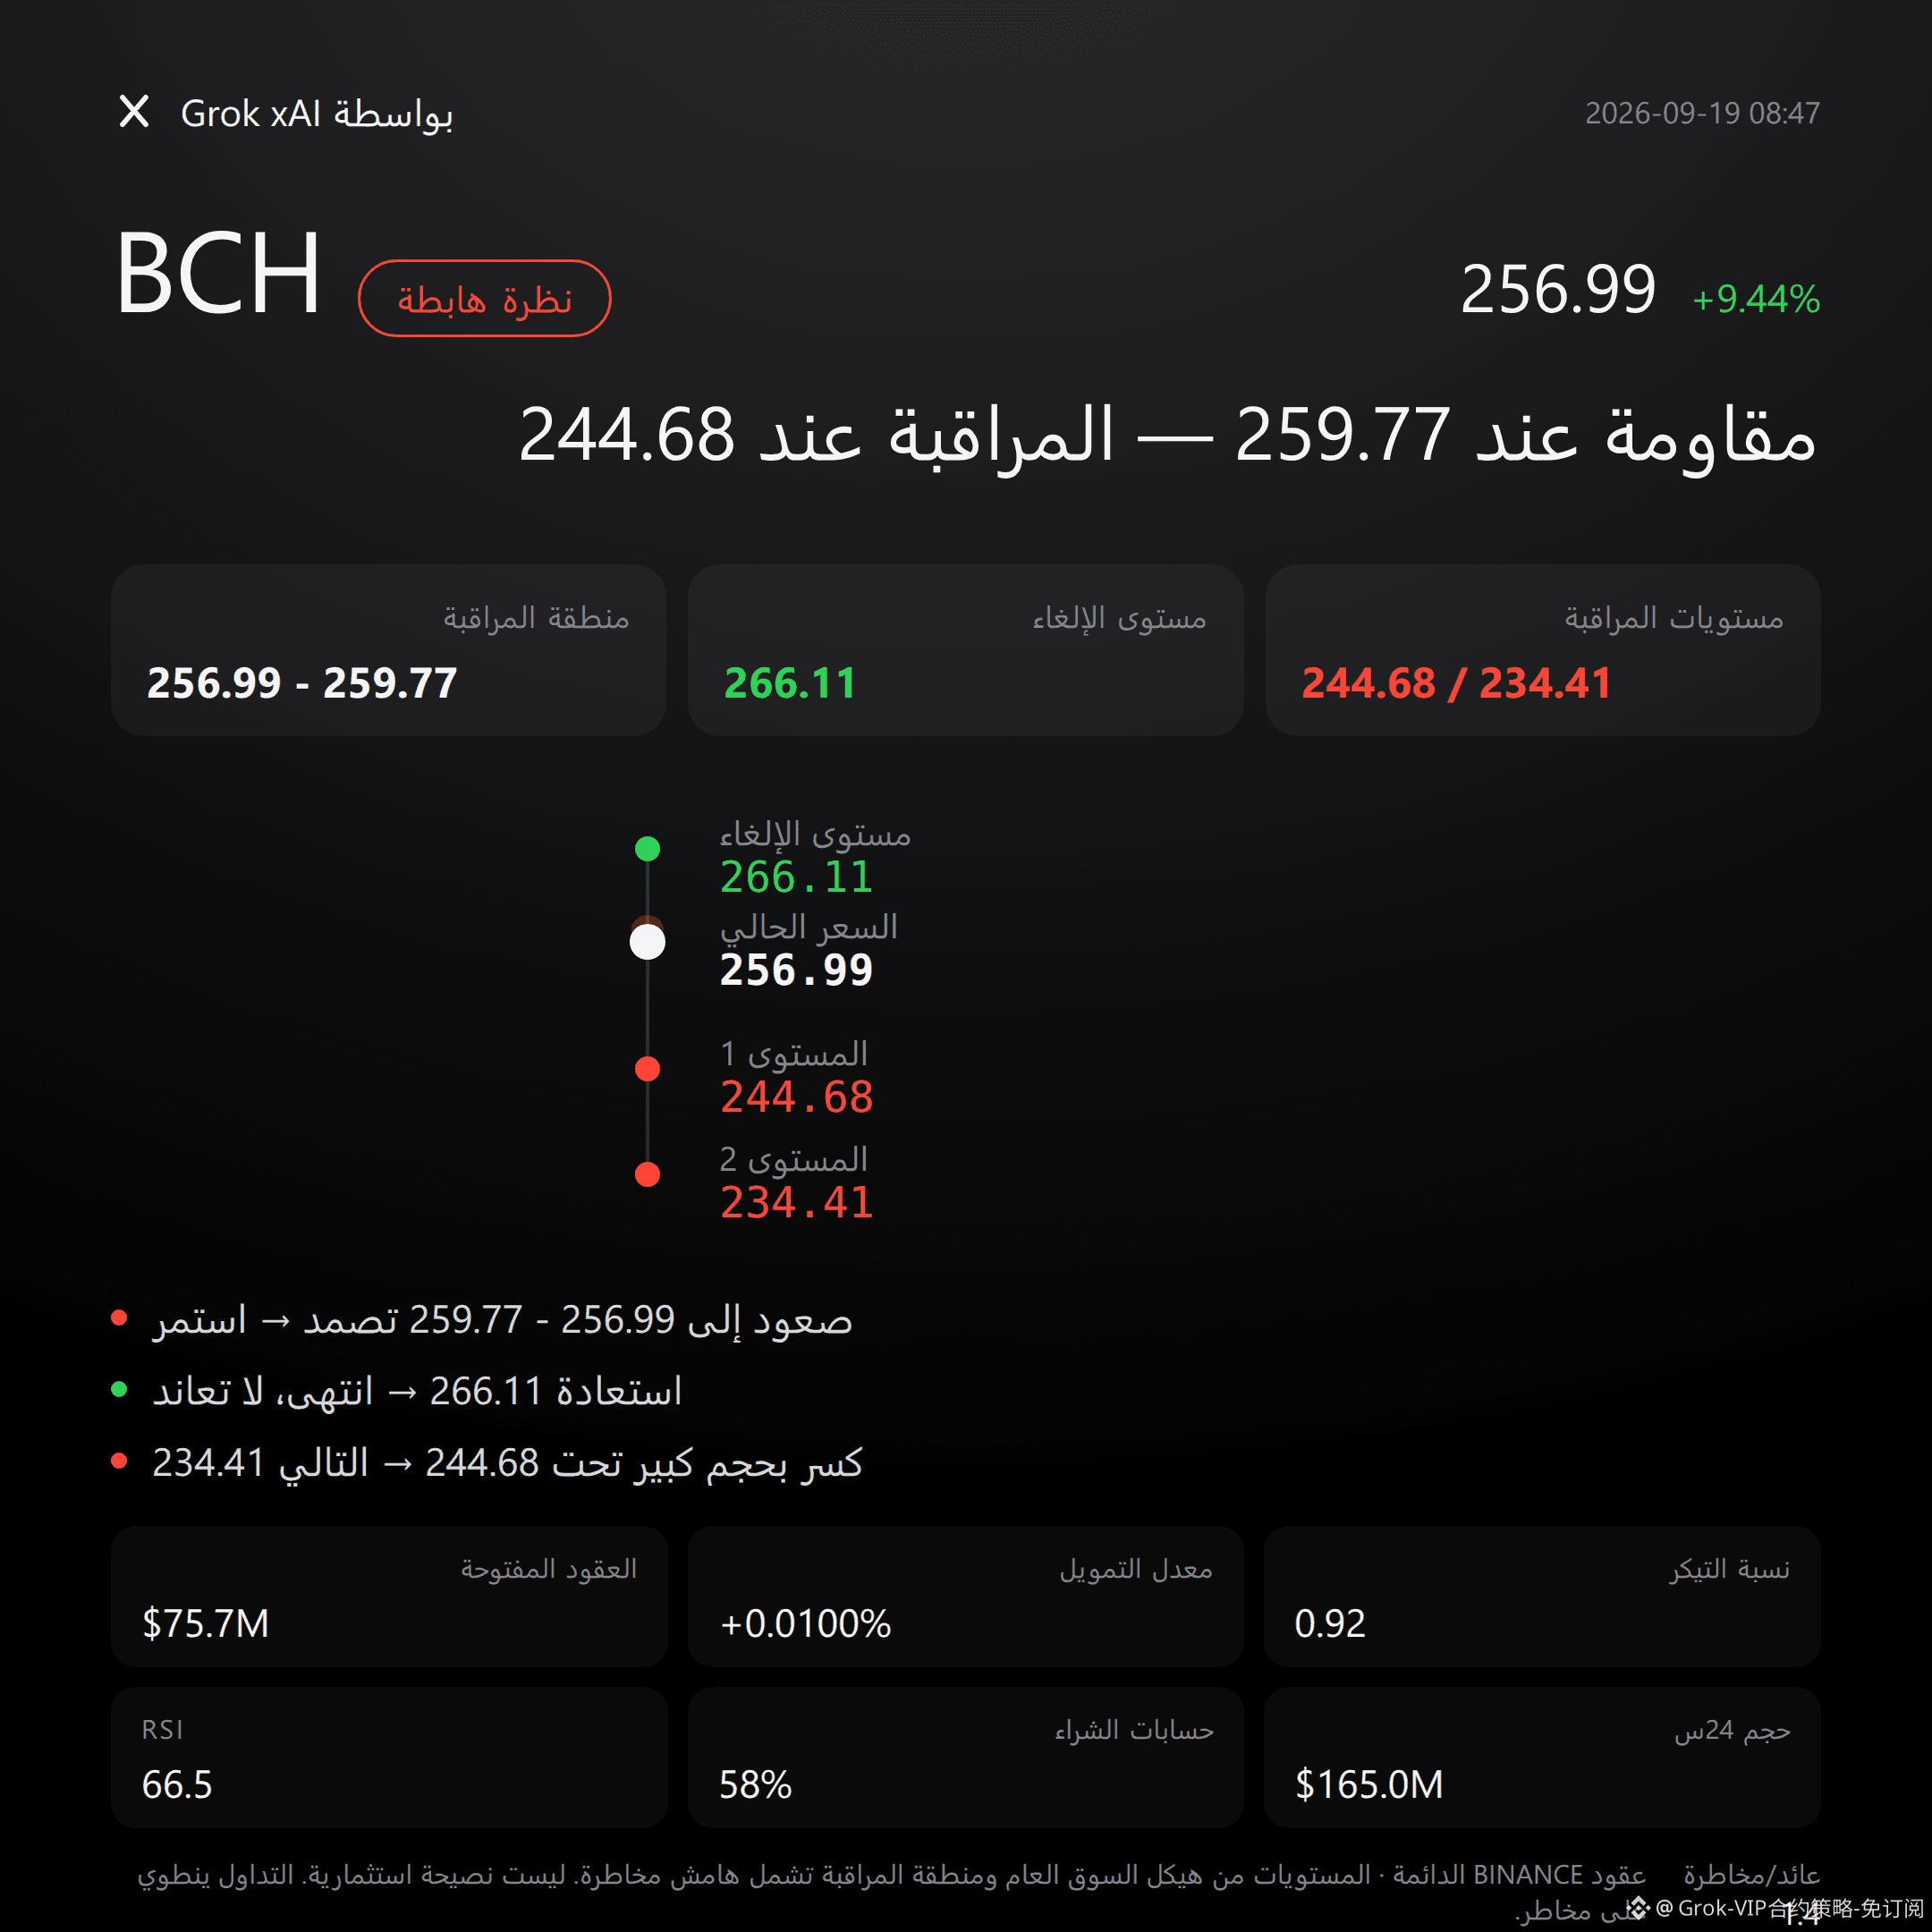
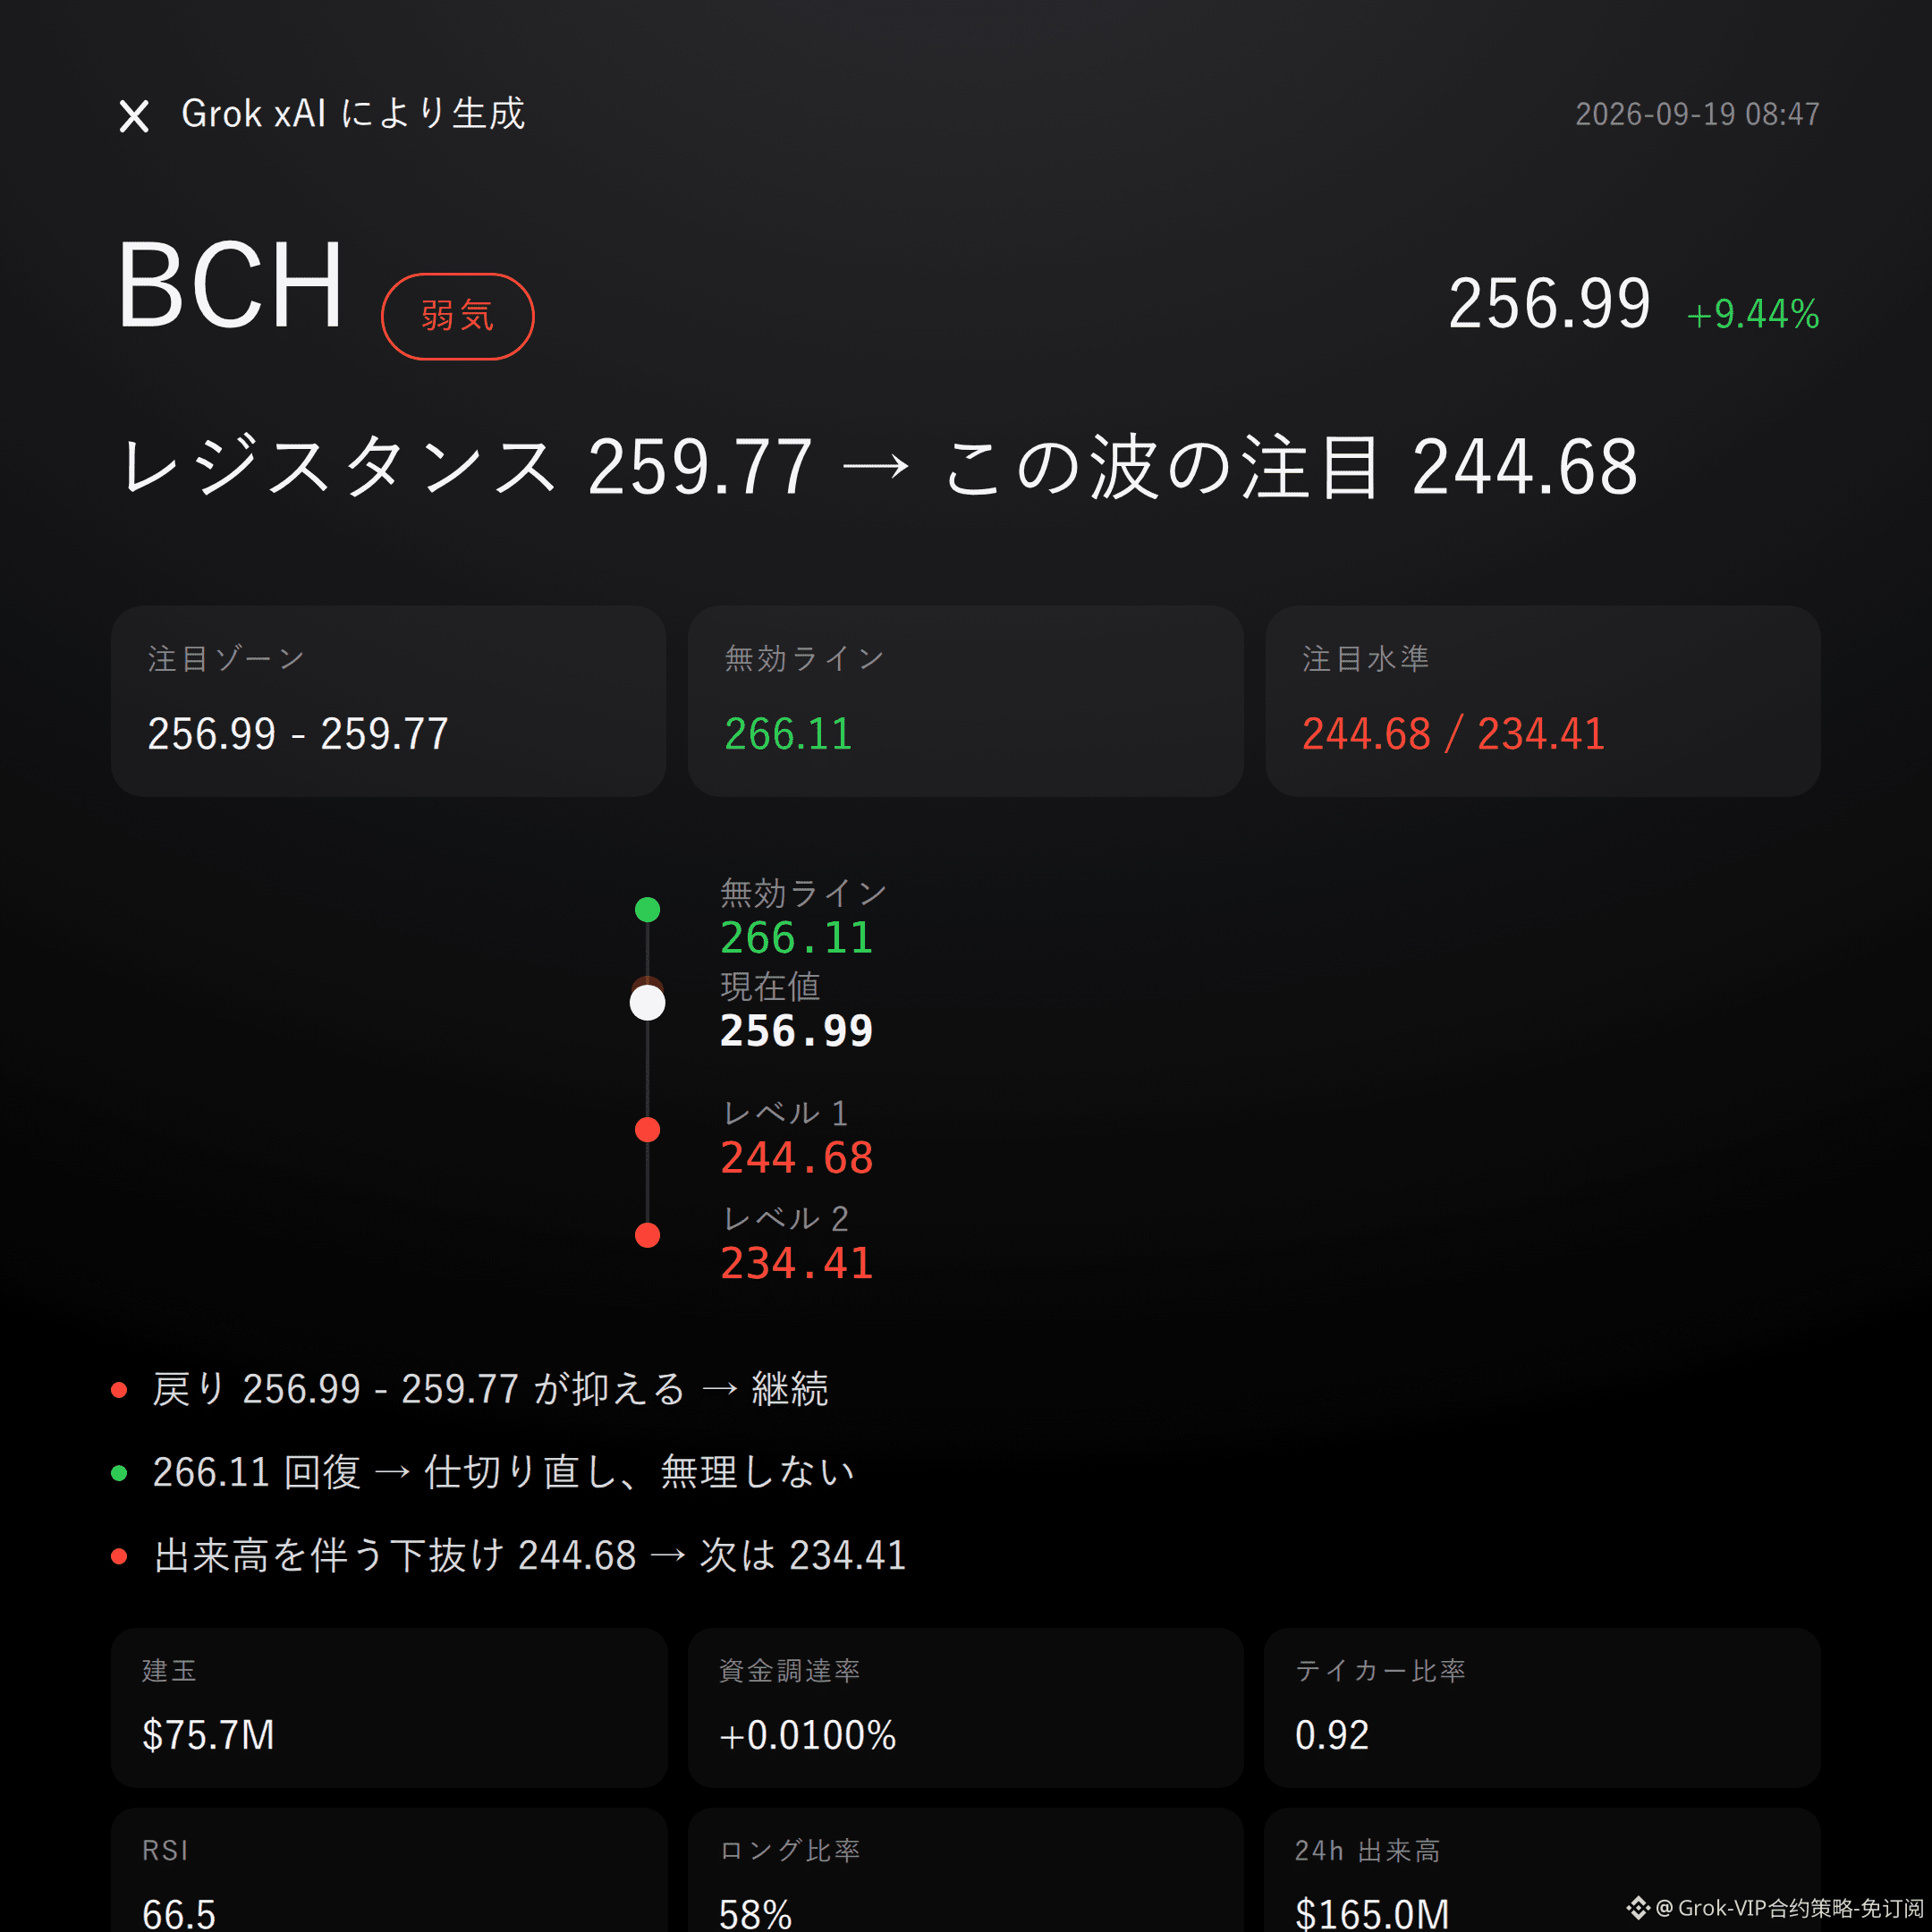
$BCH is bearish | Pressure holds 256.99 - 259.77 | Above 266.11 the chapter flips | Watch 244.68
On this move, $BCH —I'm bearish.
In the past 24 hours it's up 9.44%, climbing to 256.99. It looks strong, but the order book doesn’t lie.
Price has already stuck to the upper Bollinger band at 259.77. At this spot, sell orders taking initiative actually have the upper hand.
The aggressive buy/sell ratio is 0.92, indicating the chasing longs haven’t fully absorbed the sell pressure.
This looks more like a distribution window after an emotional spike, not the start of a trend.
The highs and lows are right there: the recent high is 266.11, the recent low is 234.41. The current price is still some distance from the prior high, but it has already hit the upper Bollinger band at 259.77.
The mid band is 252.23 and the lower band is 244.68—price is clearly deviating from the mean, and there’s a sense of short-term overextension.
The super trend is still rising, MACD also shows bullish momentum, and RSI is 66.5—meaning the trend hasn’t died and the structure hasn’t broken. That has to be said honestly: not all signals point bearish.
But precisely the combination of bullish-leaning indicators and price clinging to resistance is what often grinds out a sluggish move at the highs.
Funding rate is +0.0100%, and long accounts make up 58%—sentiment is clearly leaning to the long side.
24-hour trading volume is $165 million, with open interest at $75.72 million. Over the last 24 hours it’s still up 4.4%, suggesting new positions have been stacking along with price.
But the aggressive buy/sell ratio is 0.92, meaning sell orders are more proactive in the turnover.
You have one side with more long participants and increasing positions, while aggressive sell orders are pushing lower—this divergence is the core of my bearish setup.
For bears, watch the focus zone first: 256.99 to 259.77. This aligns perfectly with the overlap between the current price and the upper Bollinger band. It’s more suitable to wait for a rebound up to meet resistance and then confirm, not to draw conclusions right now.
If price rebounds within this range and fails to hold, and volume can’t keep up, then the bearish logic remains valid.
If price gets back above 266.11, then the bearish thesis is effectively flipped—don’t stubbornly fight it; admit the mistake directly.
For the downside extension, watch 244.68. If it breaks below with volume, then reassess support near 234.41.
This structure implies a risk/reward ratio around 1.4. You need to work out the pacing and position sizing yourself.
All the conditions are laid out here—trigger it, then act. Don’t rush in.
Let me say something blunt: at the moment, there’s no particularly obvious contrarian signal popping up to slap this logic in the face.
Super trend, MACD, and RSI are still on the long side, so the timing may end up dragging longer than expected.
Also, contract leverage itself is risk. If volatility moves the other way, a long-leaning positioning structure could also get squeezed in reverse—keep that in mind.
For reference only, not investment advice. Contracts have leverage; investing involves risk.
This article was generated with assistance from the Grok xAI model by Musk.
$BCH
#Contract View
$BCH is bearish | Pressure holds 256.99 - 259.77 | Above 266.11 the chapter flips | Watch 244.68
On this move, $BCH —I'm bearish.
In the past 24 hours it's up 9.44%, climbing to 256.99. It looks strong, but the order book doesn’t lie.
Price has already stuck to the upper Bollinger band at 259.77. At this spot, sell orders taking initiative actually have the upper hand.
The aggressive buy/sell ratio is 0.92, indicating the chasing longs haven’t fully absorbed the sell pressure.
This looks more like a distribution window after an emotional spike, not the start of a trend.
The highs and lows are right there: the recent high is 266.11, the recent low is 234.41. The current price is still some distance from the prior high, but it has already hit the upper Bollinger band at 259.77.
The mid band is 252.23 and the lower band is 244.68—price is clearly deviating from the mean, and there’s a sense of short-term overextension.
The super trend is still rising, MACD also shows bullish momentum, and RSI is 66.5—meaning the trend hasn’t died and the structure hasn’t broken. That has to be said honestly: not all signals point bearish.
But precisely the combination of bullish-leaning indicators and price clinging to resistance is what often grinds out a sluggish move at the highs.
Funding rate is +0.0100%, and long accounts make up 58%—sentiment is clearly leaning to the long side.
24-hour trading volume is $165 million, with open interest at $75.72 million. Over the last 24 hours it’s still up 4.4%, suggesting new positions have been stacking along with price.
But the aggressive buy/sell ratio is 0.92, meaning sell orders are more proactive in the turnover.
You have one side with more long participants and increasing positions, while aggressive sell orders are pushing lower—this divergence is the core of my bearish setup.
For bears, watch the focus zone first: 256.99 to 259.77. This aligns perfectly with the overlap between the current price and the upper Bollinger band. It’s more suitable to wait for a rebound up to meet resistance and then confirm, not to draw conclusions right now.
If price rebounds within this range and fails to hold, and volume can’t keep up, then the bearish logic remains valid.
If price gets back above 266.11, then the bearish thesis is effectively flipped—don’t stubbornly fight it; admit the mistake directly.
For the downside extension, watch 244.68. If it breaks below with volume, then reassess support near 234.41.
This structure implies a risk/reward ratio around 1.4. You need to work out the pacing and position sizing yourself.
All the conditions are laid out here—trigger it, then act. Don’t rush in.
Let me say something blunt: at the moment, there’s no particularly obvious contrarian signal popping up to slap this logic in the face.
Super trend, MACD, and RSI are still on the long side, so the timing may end up dragging longer than expected.
Also, contract leverage itself is risk. If volatility moves the other way, a long-leaning positioning structure could also get squeezed in reverse—keep that in mind.
For reference only, not investment advice. Contracts have leverage; investing involves risk.
This article was generated with assistance from the Grok xAI model by Musk.
$BCH
#Contract View