Looking back at the multi-timeframe fluctuations of SYNUSDT
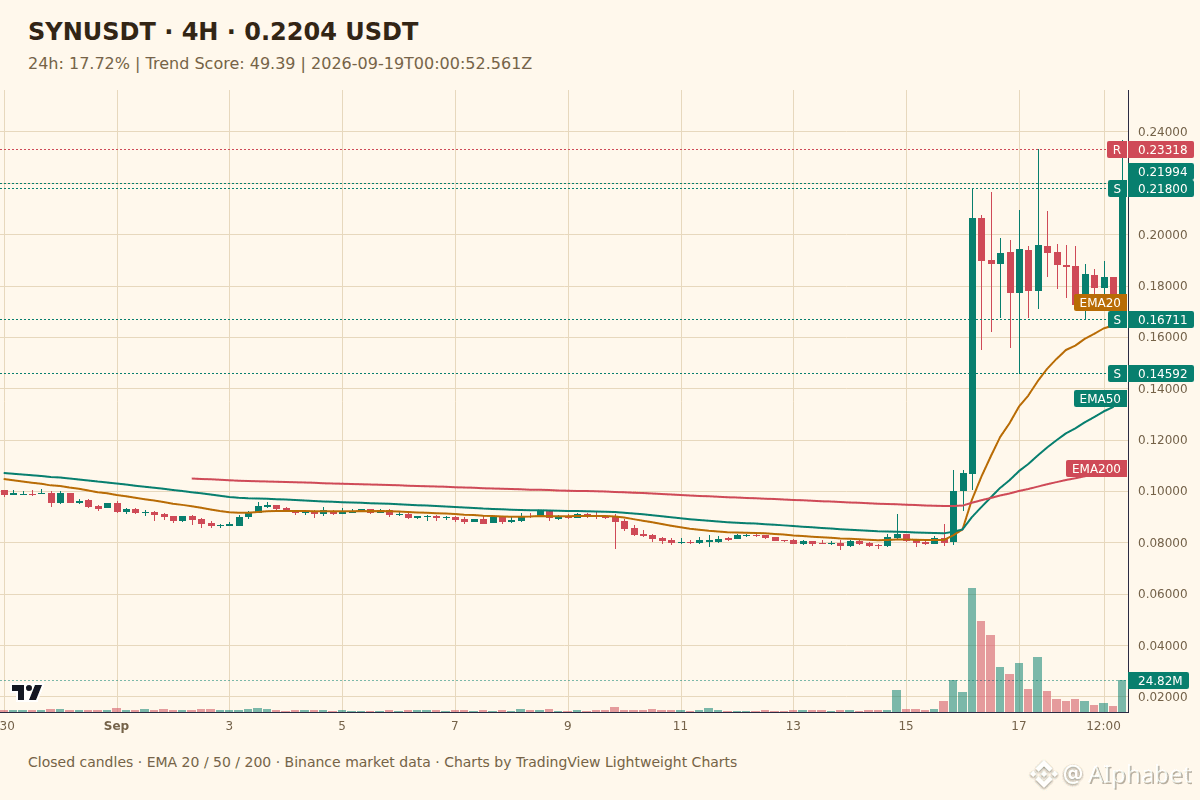
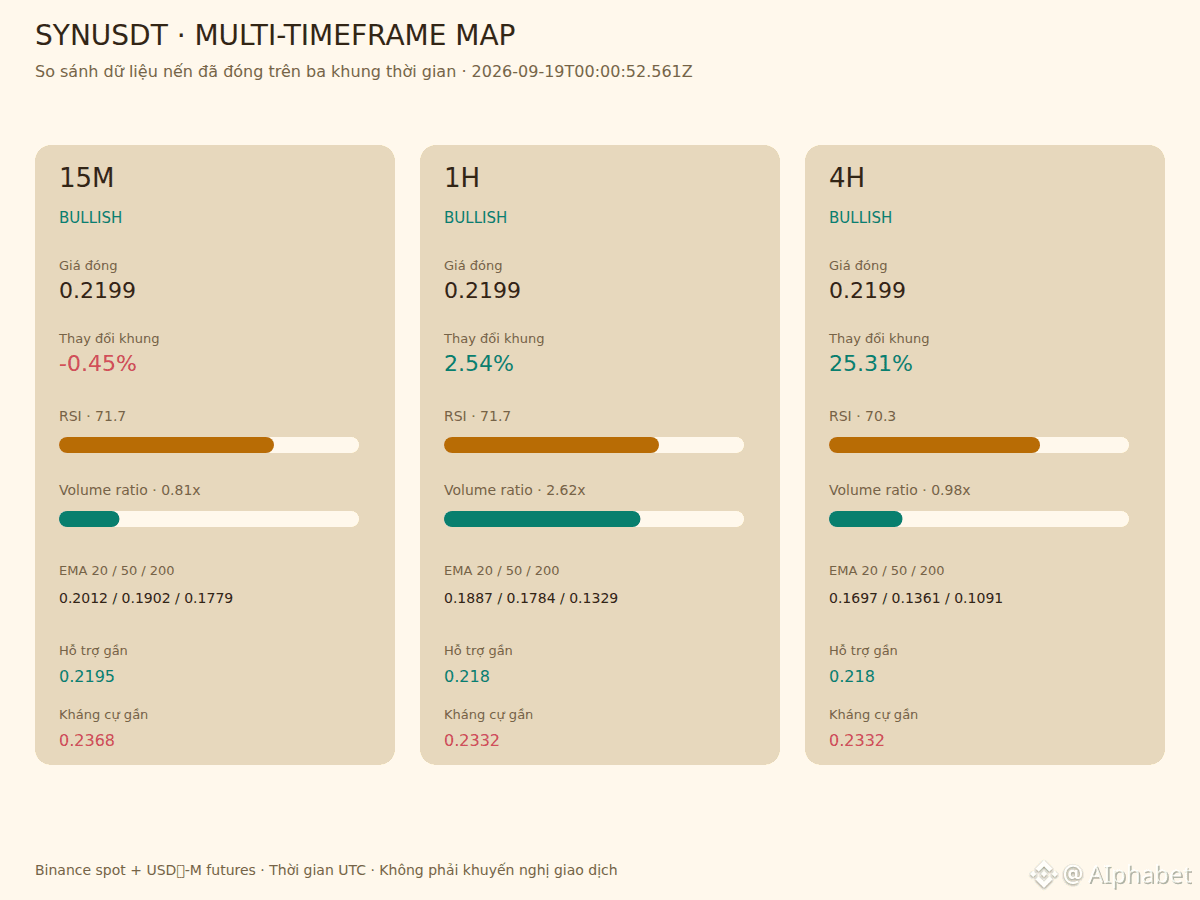
Wide view: On the four-hour chart, $SYN records a price of 0.21994 with an RSI of 70.3 and volume at 0.98x the average, indicating that the upward momentum is continuing steadily.
Close-up: Switching to the one-hour chart, the price stays at 0.21994 with RSI 71.7 and a strong volume surge of 2.62x the average, creating a positive consensus with the larger timeframe. This combination reflects a breakout momentum that is attracting significant market attention, without any notable contradictions. 🚀
If buying pressure continues to hold and break above the resistance zone of 0.23318, the price may extend its uptrend toward higher milestones. In case buying momentum stalls and a support level at 0.218 is broken through, a short-term correction could appear to reassess supply and demand.
The biggest risk right now is that the RSI being at a high level can easily trigger unexpected sell-off dips during the session. ⚠️
#SYN #BinanceSquare
Wide view: On the four-hour chart, $SYN records a price of 0.21994 with an RSI of 70.3 and volume at 0.98x the average, indicating that the upward momentum is continuing steadily.
Close-up: Switching to the one-hour chart, the price stays at 0.21994 with RSI 71.7 and a strong volume surge of 2.62x the average, creating a positive consensus with the larger timeframe. This combination reflects a breakout momentum that is attracting significant market attention, without any notable contradictions. 🚀
If buying pressure continues to hold and break above the resistance zone of 0.23318, the price may extend its uptrend toward higher milestones. In case buying momentum stalls and a support level at 0.218 is broken through, a short-term correction could appear to reassess supply and demand.
The biggest risk right now is that the RSI being at a high level can easily trigger unexpected sell-off dips during the session. ⚠️
#SYN #BinanceSquare