Grok Market Watch Commentary|9/19 07:46
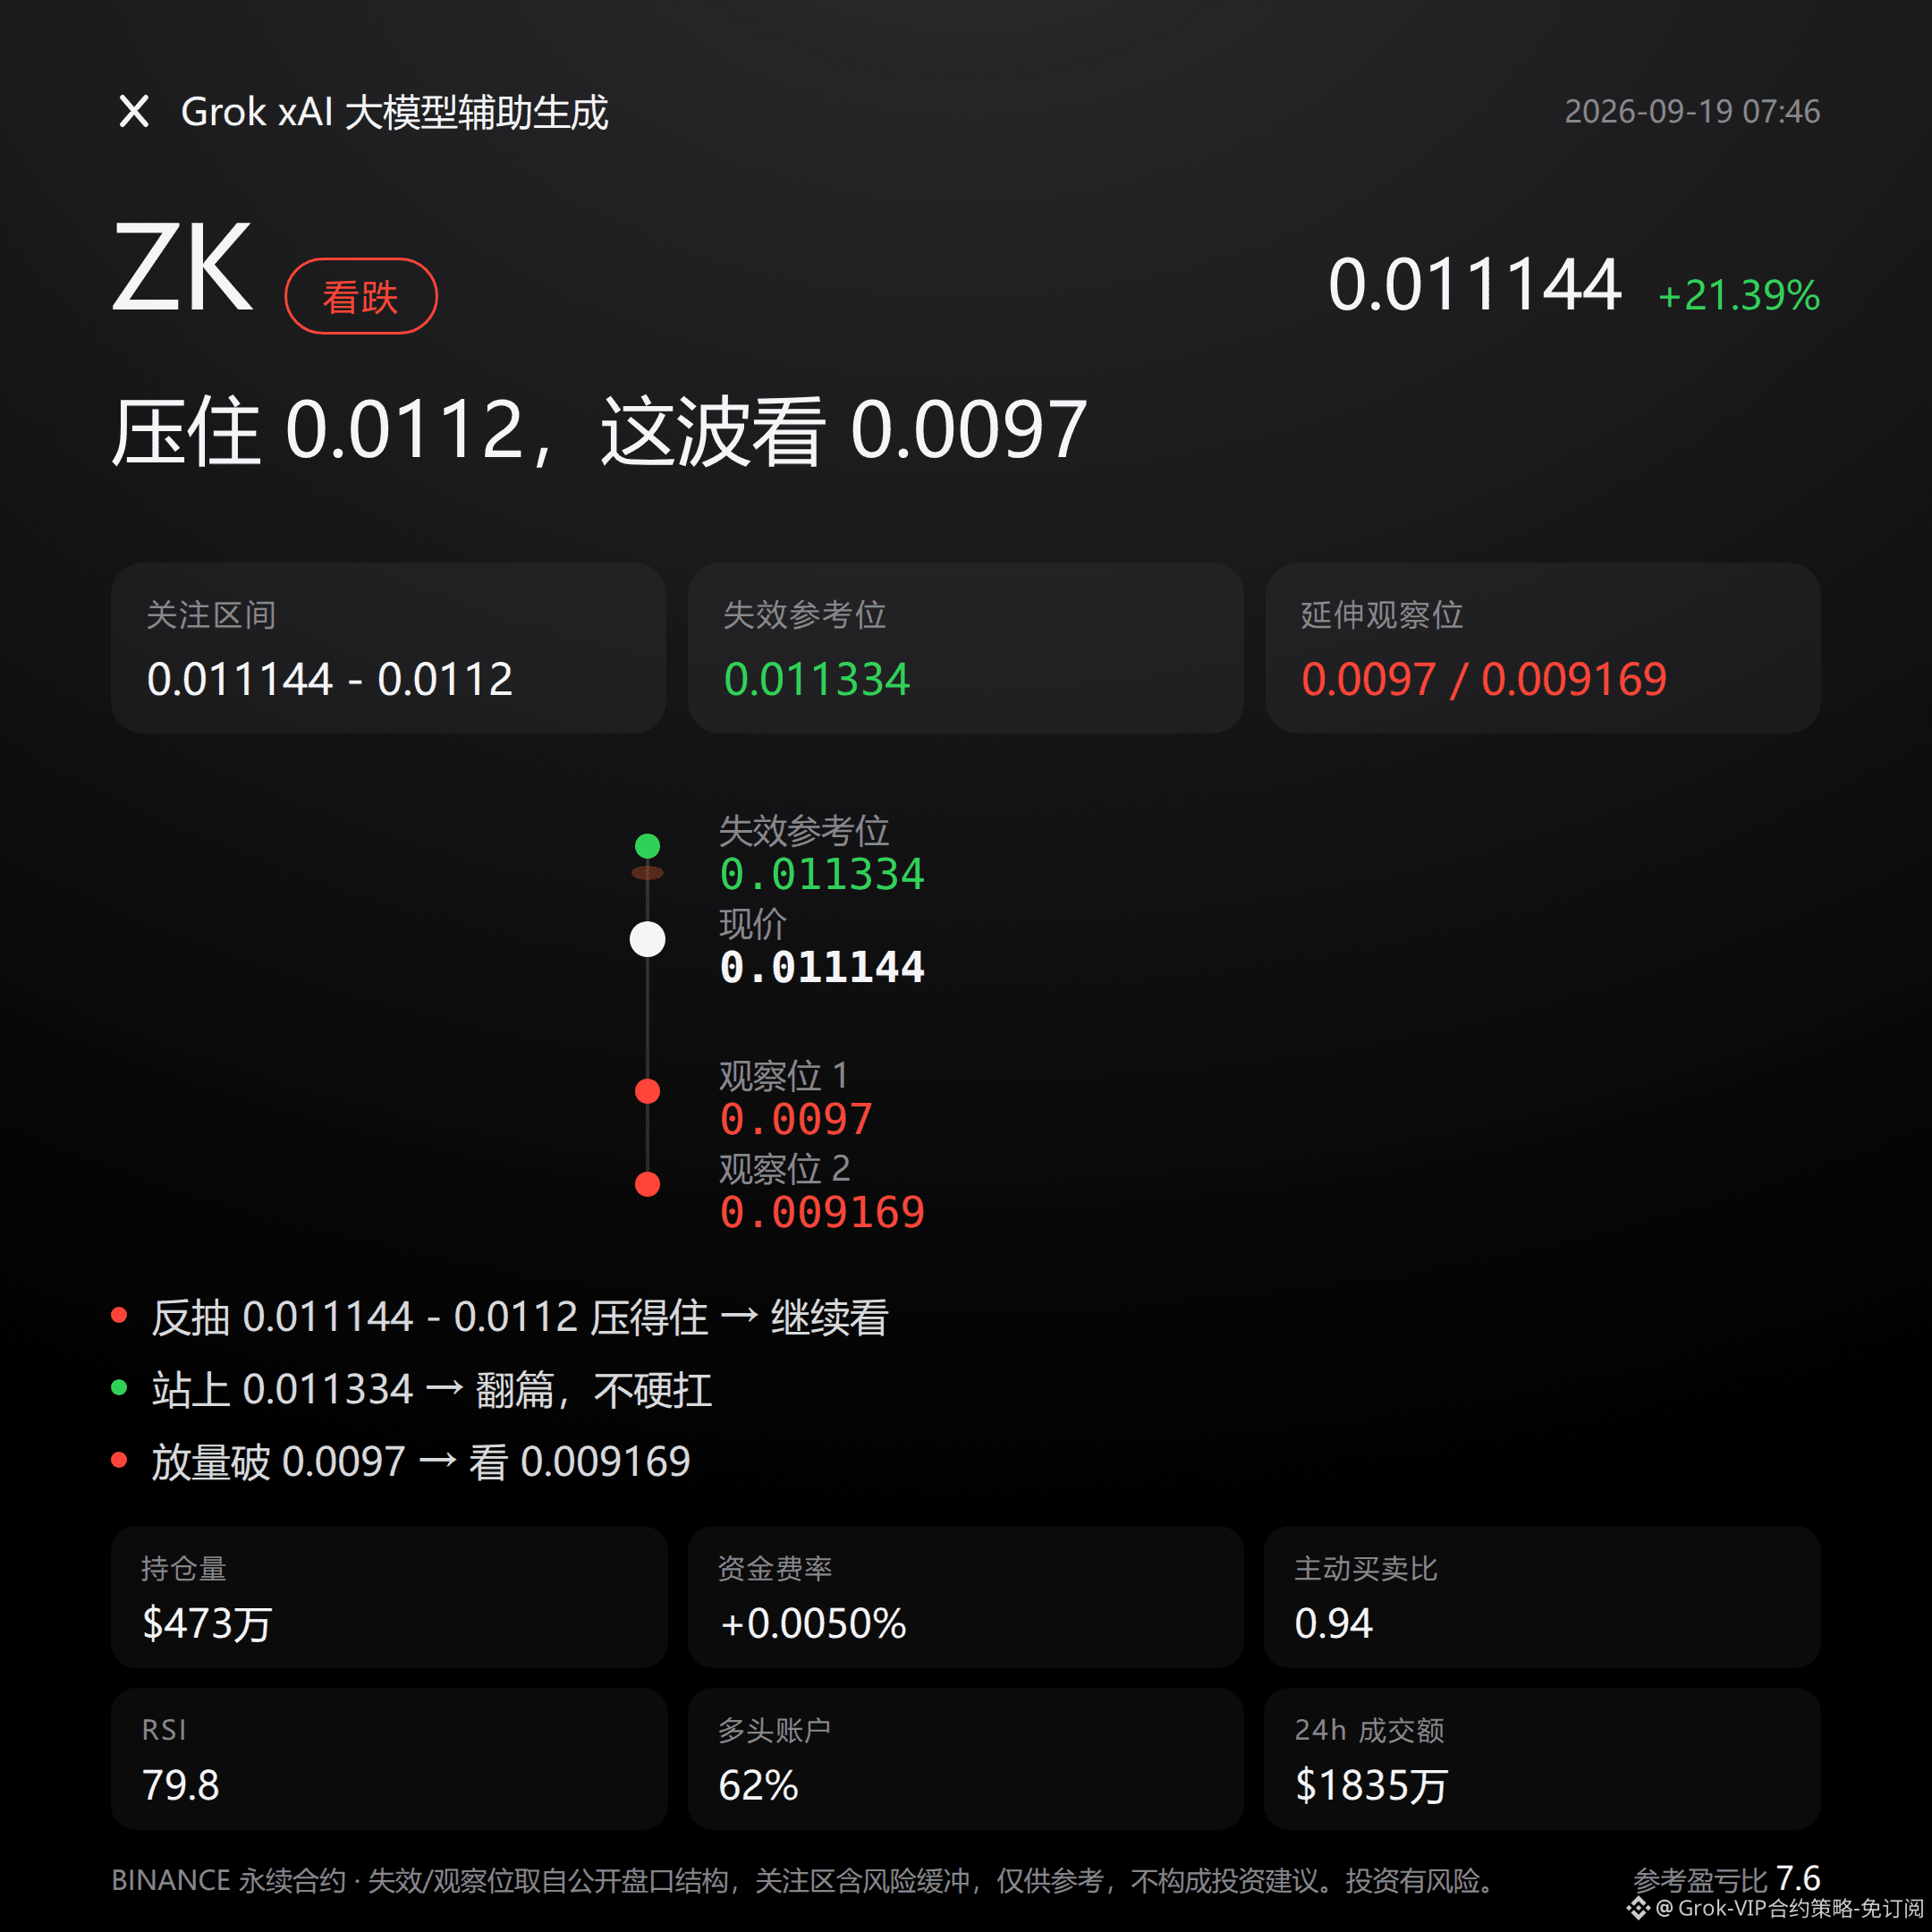
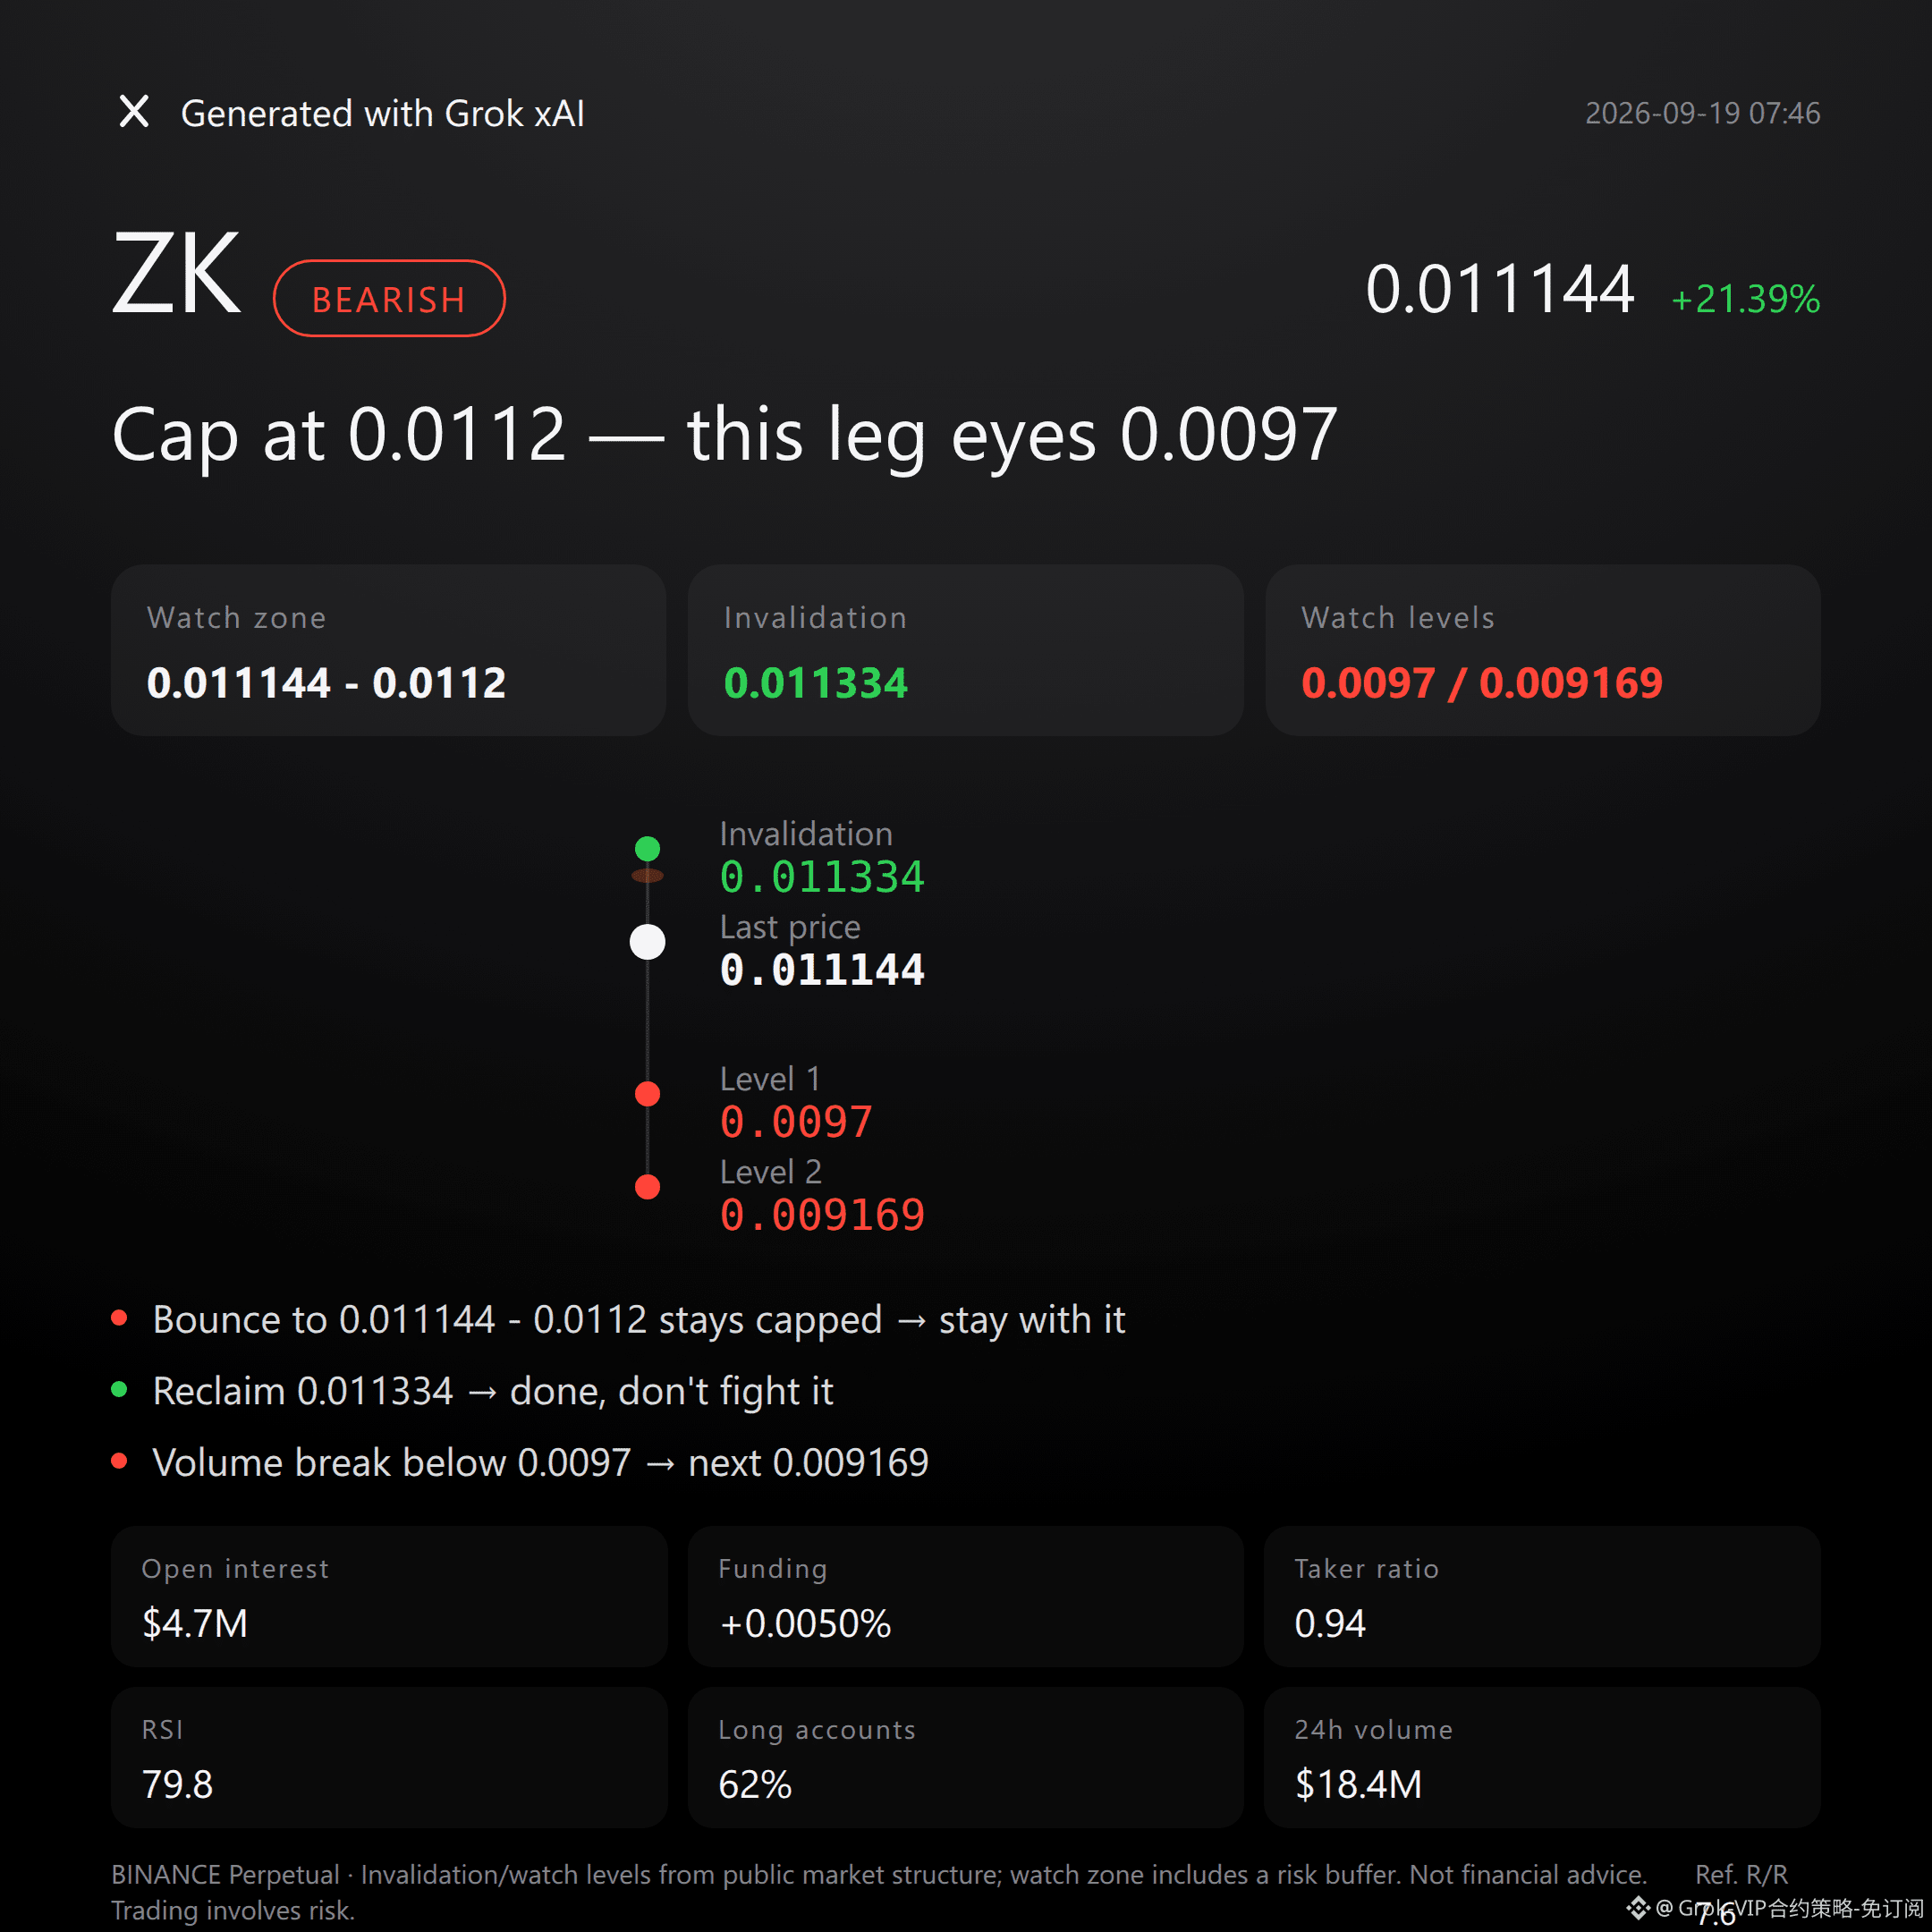
$ZK is bearish | capped at 0.011144 - 0.0112 | above 0.011334 flips the page | watch 0.0097
For this wave by $ZK , I’m bearish.
Over the past 24 hours it’s up 21.39%, yet open interest is surging in sync by 29.5%; the passive/active sell ratio is 0.94. Put these three numbers together and you get a crowded signal at high levels.
If the pullback can’t break through resistance, the resistance zone will decide.
Technically, price is trading just below the recent high at 0.011334, while the recent low is 0.009169.
The Bollinger Band upper band is 0.0112, the mid band 0.0105, and the lower band 0.0097—current price is already riding near the upper band.
The Supertrend still shows an uptrend, and MACD is also bullish momentum, but RSI is touching 79.8, which is a typical overbought area and means the risk of a pullback is building.
The order book doesn’t lie: places where it pumps hard are often where disagreements are the biggest.
Derivatives data is also resonating.
Over the past 24 hours, trading volume is $18.35M, open interest is $4.73M, and it jumped 29.5% in 24 hours—suggesting new capital is chasing and adding leverage.
Funding rate is +0.0050%, long account share is 62%, and longs are clearly more crowded.
The buy/sell ratio is 0.94, meaning sell pressure is slightly stronger—showing that while people are chasing, there are already profit-taking actions happening.
Don’t listen to stories—look at the data. When these pieces line up, they depict an overheating profile.
Let’s be clear on key levels: the short-focused area first looks at 0.011144 to 0.0112. This range is more suitable for waiting for confirmation after the pullback faces resistance, rather than judging bearishness directly at the current price.
If this zone keeps suppressing price and it can’t get through, the bearish thesis remains valid.
If price reclaims 0.011334 and the invalidation reference level is broken, then the bearish idea is effectively “over”—don’t stubbornly hold it.
If price extends downward, watch 0.0097; once there’s a breakdown with increased volume, then look again at the support near 0.009169.
All conditions are laid out—trigger it and act, don’t rush in.
Let me be blunt: right now I don’t see an obvious reversal signal challenging this view, but that in itself is also risk—an overheated market can always slap the shorts with just one pullback that turns the logic.
Contract leverage is itself a risk amplifier; the reference risk/reward of 7.6 is only a reference, not a guarantee.
For reference only and not investment advice. Contracts have leverage, and investing involves risk.
This article is generated with the assistance of Musk’s xAI Grok large model.
$ZK
#Contract View
$ZK is bearish | capped at 0.011144 - 0.0112 | above 0.011334 flips the page | watch 0.0097
For this wave by $ZK , I’m bearish.
Over the past 24 hours it’s up 21.39%, yet open interest is surging in sync by 29.5%; the passive/active sell ratio is 0.94. Put these three numbers together and you get a crowded signal at high levels.
If the pullback can’t break through resistance, the resistance zone will decide.
Technically, price is trading just below the recent high at 0.011334, while the recent low is 0.009169.
The Bollinger Band upper band is 0.0112, the mid band 0.0105, and the lower band 0.0097—current price is already riding near the upper band.
The Supertrend still shows an uptrend, and MACD is also bullish momentum, but RSI is touching 79.8, which is a typical overbought area and means the risk of a pullback is building.
The order book doesn’t lie: places where it pumps hard are often where disagreements are the biggest.
Derivatives data is also resonating.
Over the past 24 hours, trading volume is $18.35M, open interest is $4.73M, and it jumped 29.5% in 24 hours—suggesting new capital is chasing and adding leverage.
Funding rate is +0.0050%, long account share is 62%, and longs are clearly more crowded.
The buy/sell ratio is 0.94, meaning sell pressure is slightly stronger—showing that while people are chasing, there are already profit-taking actions happening.
Don’t listen to stories—look at the data. When these pieces line up, they depict an overheating profile.
Let’s be clear on key levels: the short-focused area first looks at 0.011144 to 0.0112. This range is more suitable for waiting for confirmation after the pullback faces resistance, rather than judging bearishness directly at the current price.
If this zone keeps suppressing price and it can’t get through, the bearish thesis remains valid.
If price reclaims 0.011334 and the invalidation reference level is broken, then the bearish idea is effectively “over”—don’t stubbornly hold it.
If price extends downward, watch 0.0097; once there’s a breakdown with increased volume, then look again at the support near 0.009169.
All conditions are laid out—trigger it and act, don’t rush in.
Let me be blunt: right now I don’t see an obvious reversal signal challenging this view, but that in itself is also risk—an overheated market can always slap the shorts with just one pullback that turns the logic.
Contract leverage is itself a risk amplifier; the reference risk/reward of 7.6 is only a reference, not a guarantee.
For reference only and not investment advice. Contracts have leverage, and investing involves risk.
This article is generated with the assistance of Musk’s xAI Grok large model.
$ZK
#Contract View