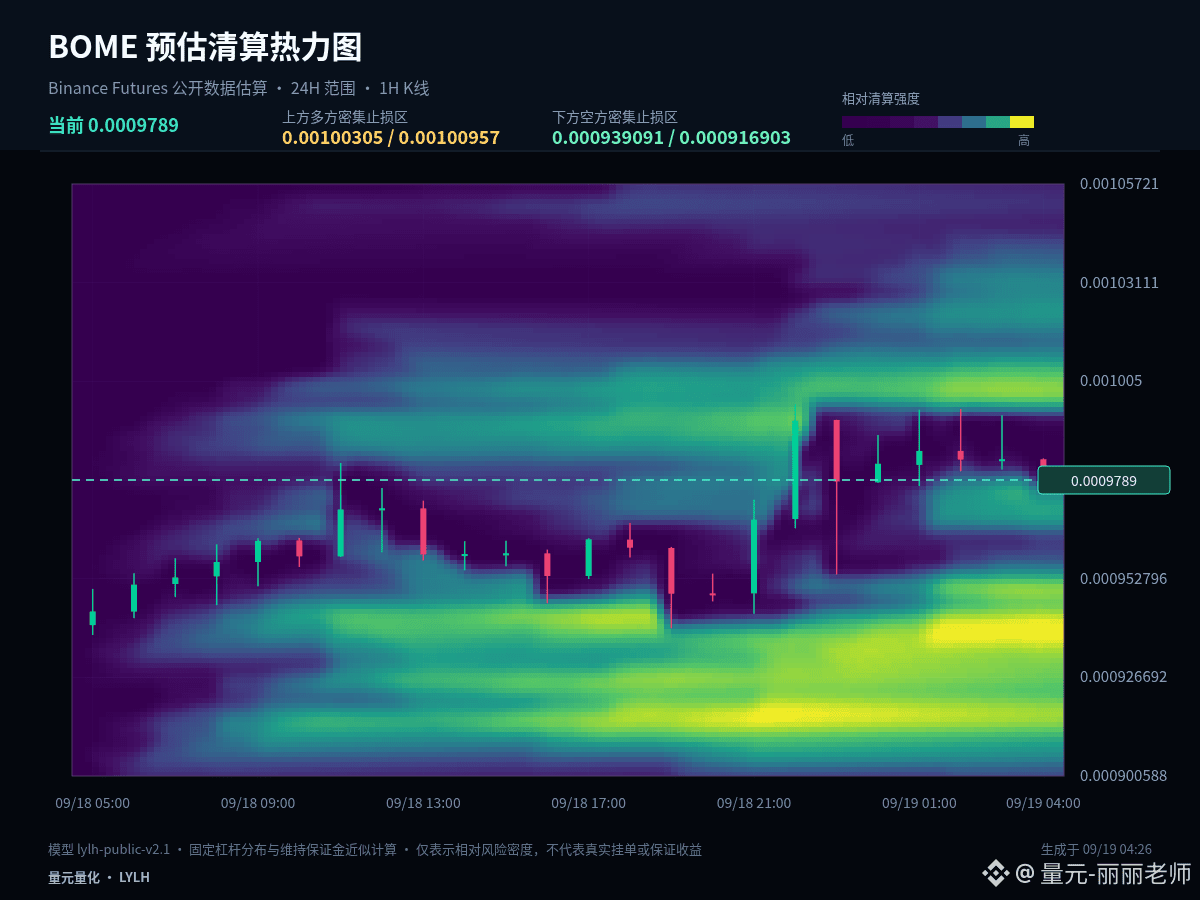
$BOME #BOME Current price 0.0009795. This time I’m not only looking at the rise/fall percentage—I’m putting the 1-hour structure together with the estimated liquidation distribution to see which side the price is more likely to seek liquidity next.
From the cycle alignment, over 24 hours it’s still +3.73%, while the 1-hour has pulled back to -0.61%, which looks more like a cooldown inside an upward structure. If the retracement doesn’t break the key support, it’s normal rotation; if support is lost and the rebound lacks strength, then near-term control shifts from bulls to bears.
In the chart, the main liquidity on both sides clusters around 0.00100305 / 0.00093909. When analyzing, don’t mechanically interpret the highlighted bright zones as support or resistance. A more reasonable use is to mark potential volatility targets in advance, then confirm with the 1-hour candlestick’s feedback after price reaches those areas.
In terms of price structure, 0.0009717 is the intraday midline. The usual resistance and support are 0.0010044 and 0.000939, respectively. The heatmap price levels are for observing potential liquidity, while key levels on the candlestick chart are for confirming the structure. When they overlap, the reference value is higher; if they don’t, then the price’s actual reaction is what matters.
My projection isn’t a single, one-direction bet. If price breaks above 0.0010044 and can hold, it means the upside space has been reopened. If it falls below 0.000939 and fails to retest on the bounce, it means the structure is further weakened. If it stays trading between the two, then we continue to watch the closing behavior on both sides of 0.0009717.
A trading plan must include invalidation conditions. If you’re right, you can realize gains in stages. If you’re wrong, you must also allow yourself to exit—don’t use adding to position to cover the fact that the original logic has changed. The market will update, and your viewpoint should adjust according to price evidence.
The market will ultimately validate your thesis with price. Do you think the most crucial thing right now is the break of 0.0010044, or the defense of 0.000939? Let’s track the subsequent results together.
#HKMAPlansWholesaleCBDCByYearEnd
From the cycle alignment, over 24 hours it’s still +3.73%, while the 1-hour has pulled back to -0.61%, which looks more like a cooldown inside an upward structure. If the retracement doesn’t break the key support, it’s normal rotation; if support is lost and the rebound lacks strength, then near-term control shifts from bulls to bears.
In the chart, the main liquidity on both sides clusters around 0.00100305 / 0.00093909. When analyzing, don’t mechanically interpret the highlighted bright zones as support or resistance. A more reasonable use is to mark potential volatility targets in advance, then confirm with the 1-hour candlestick’s feedback after price reaches those areas.
In terms of price structure, 0.0009717 is the intraday midline. The usual resistance and support are 0.0010044 and 0.000939, respectively. The heatmap price levels are for observing potential liquidity, while key levels on the candlestick chart are for confirming the structure. When they overlap, the reference value is higher; if they don’t, then the price’s actual reaction is what matters.
My projection isn’t a single, one-direction bet. If price breaks above 0.0010044 and can hold, it means the upside space has been reopened. If it falls below 0.000939 and fails to retest on the bounce, it means the structure is further weakened. If it stays trading between the two, then we continue to watch the closing behavior on both sides of 0.0009717.
A trading plan must include invalidation conditions. If you’re right, you can realize gains in stages. If you’re wrong, you must also allow yourself to exit—don’t use adding to position to cover the fact that the original logic has changed. The market will update, and your viewpoint should adjust according to price evidence.
The market will ultimately validate your thesis with price. Do you think the most crucial thing right now is the break of 0.0010044, or the defense of 0.000939? Let’s track the subsequent results together.
#HKMAPlansWholesaleCBDCByYearEnd