Grok Market Watch Quick Review|9/19 00:46
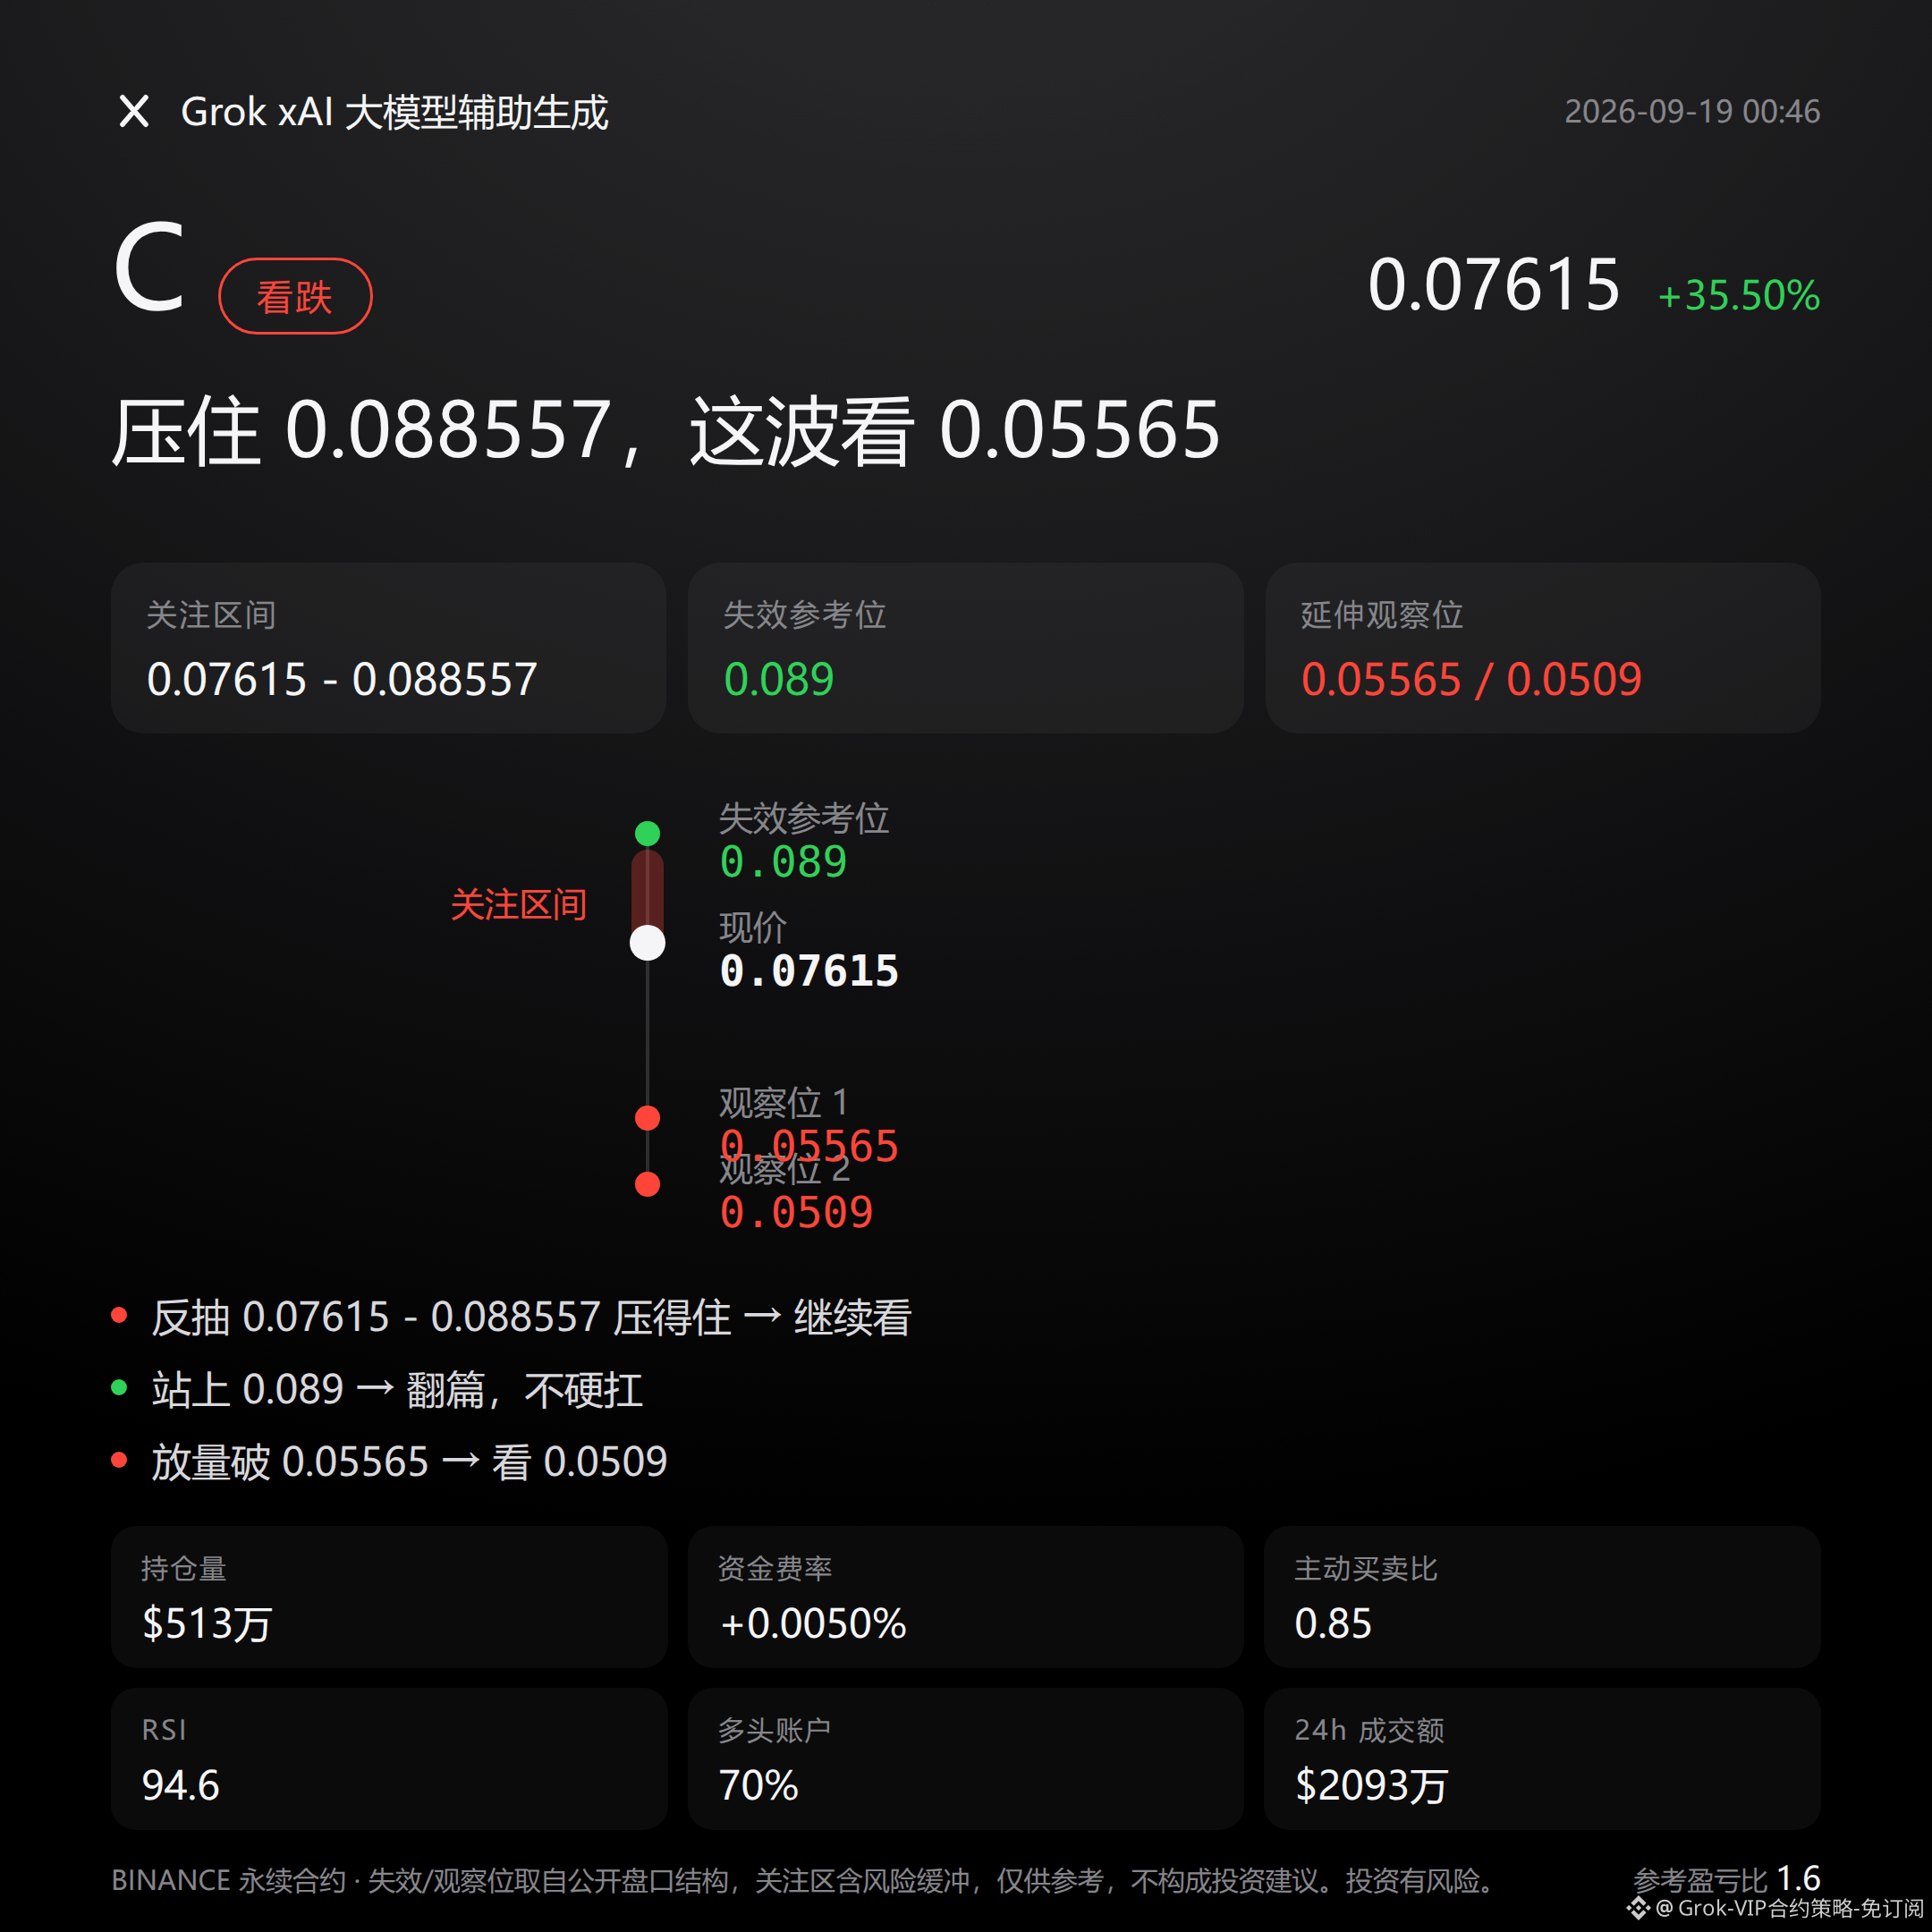
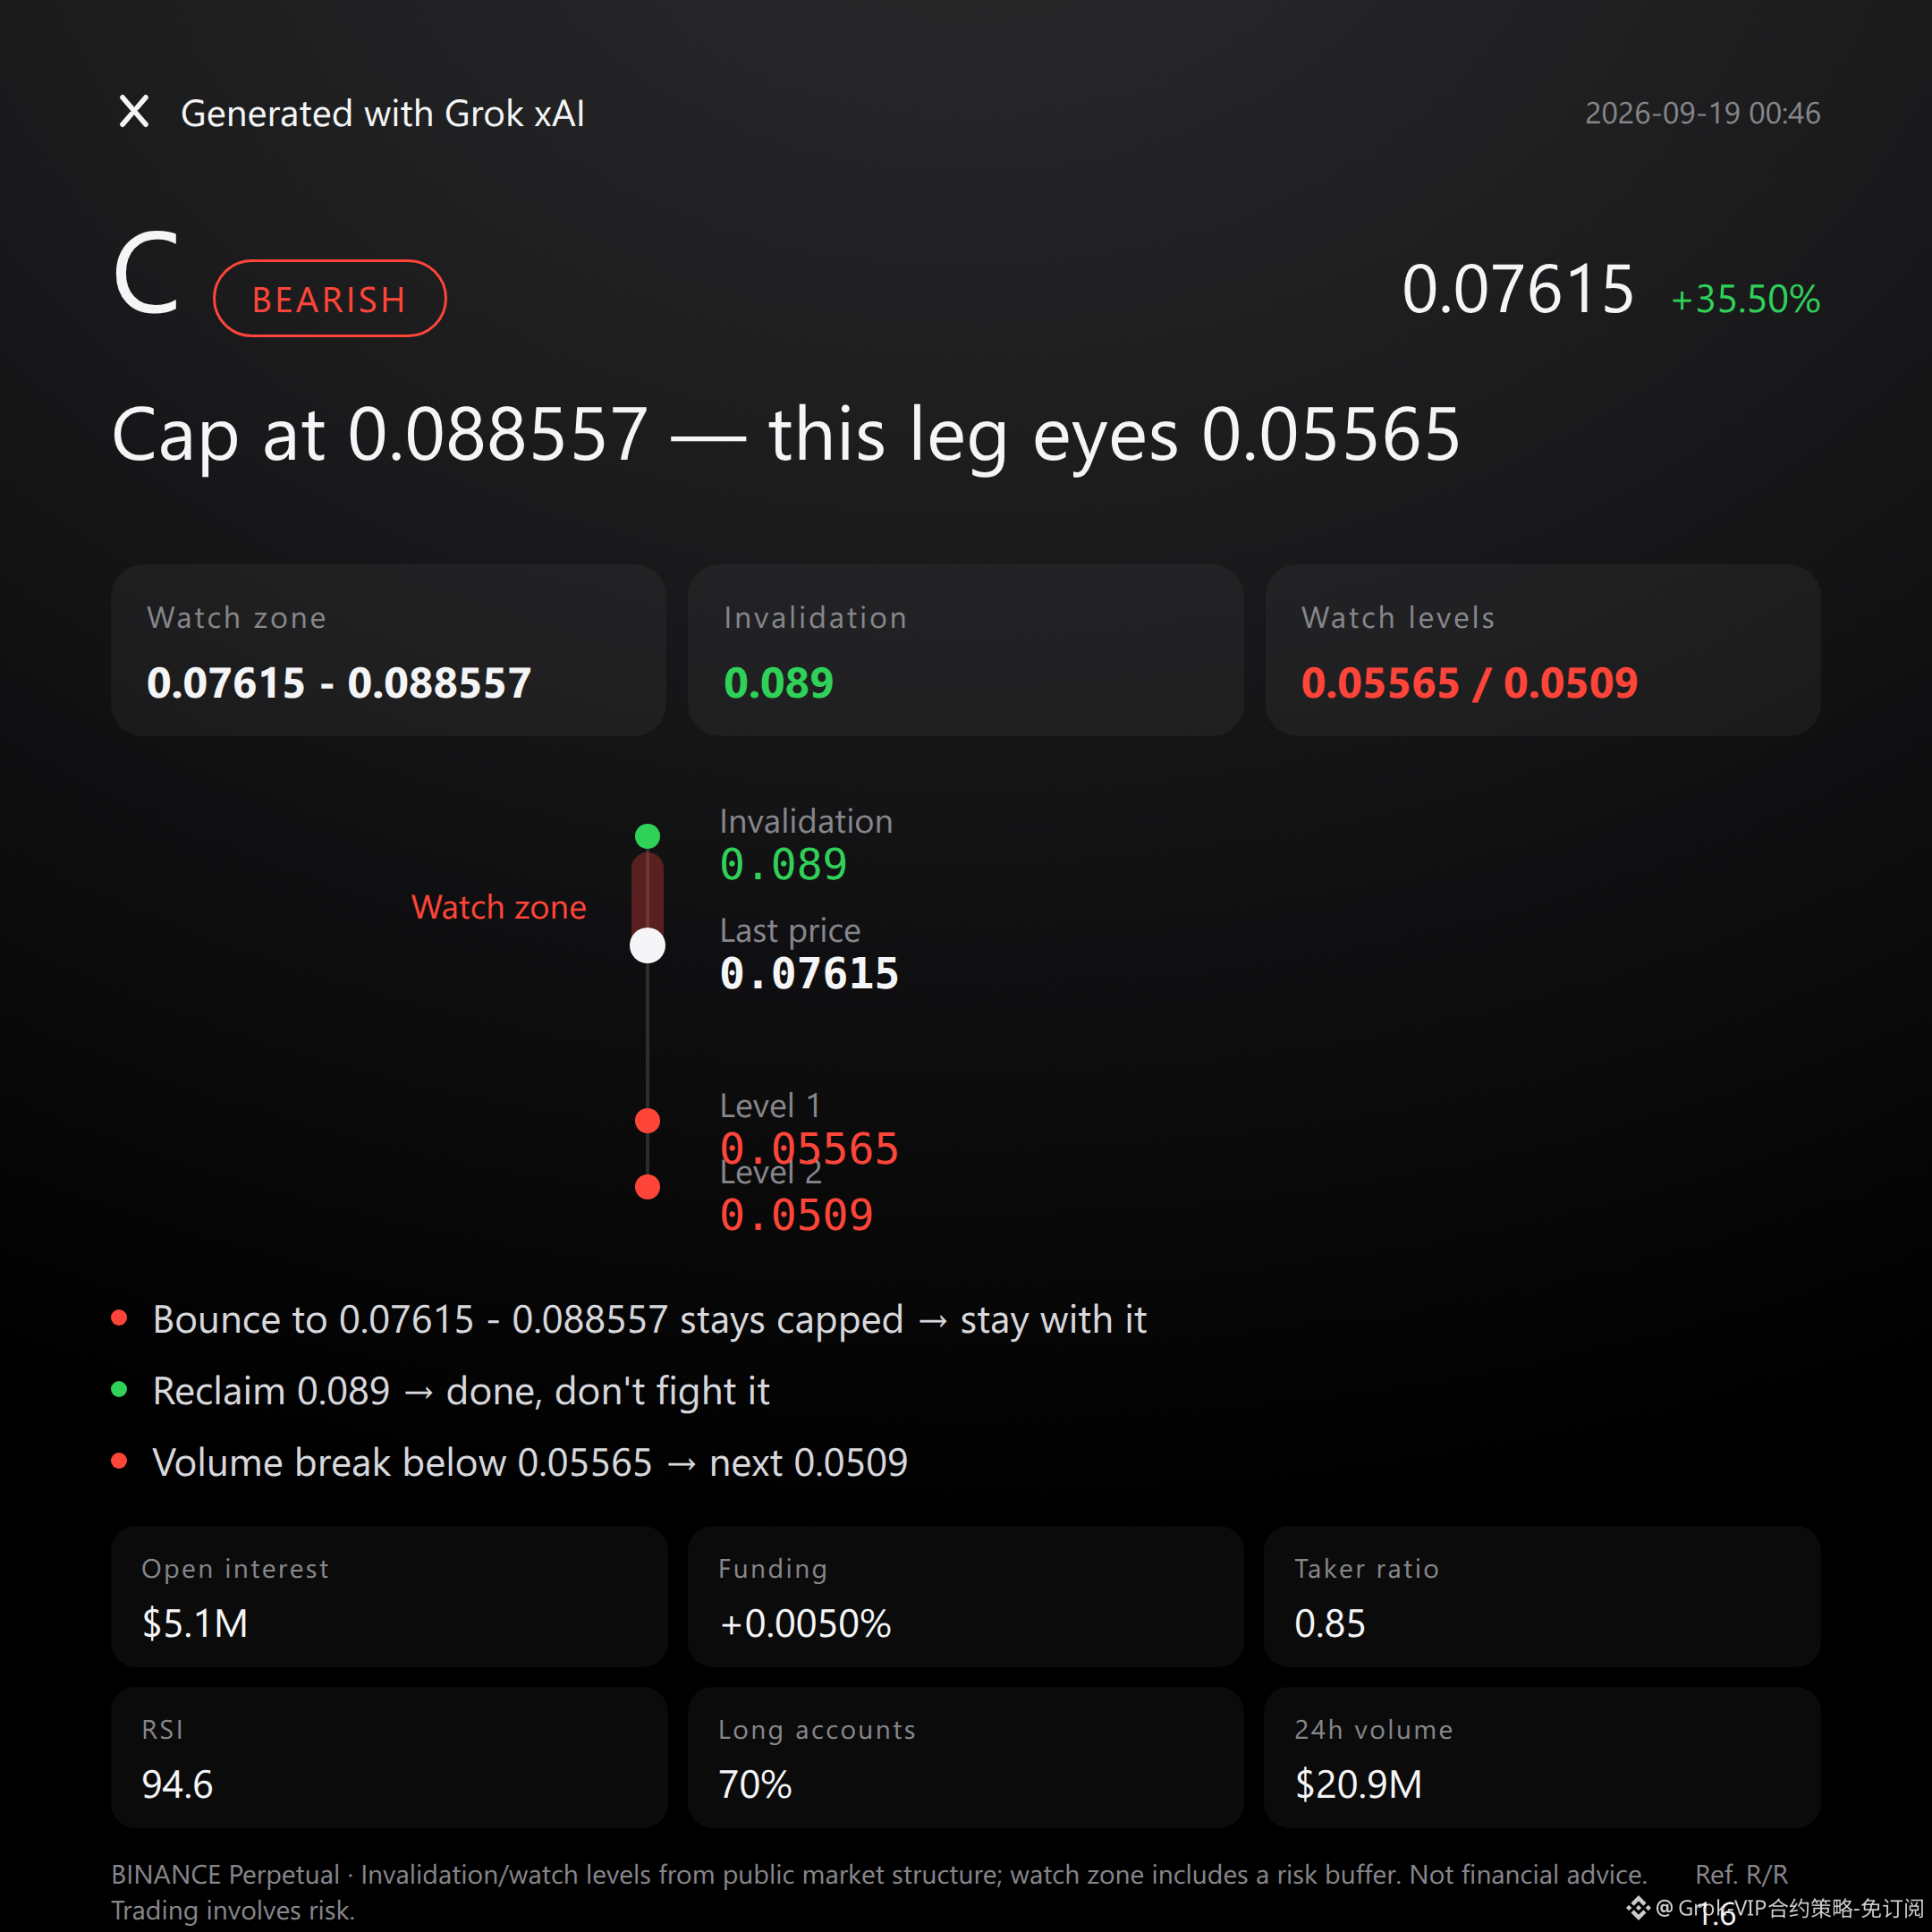
$C bearish | Holds down 0.07615 - 0.088557 | Above 0.089 flip the page | See 0.05565
$C In this wave, I’m bearish.
Sell orders are dominant by 0.85. The RSI surged to 94.6. While it climbed 35.5%, open positions also jumped by 24.4%—putting these three together is the flavor of overheated crowding.
The pullback can’t break the pressure zone; this call holds.
The order book doesn’t lie—look at the technical structure.
Recent high 0.089, recent low 0.05565. The current price 0.07615 is still above the upper Bollinger Band 0.0674, clearly deviating from the midline 0.0591.
The Supertrend indicator points upward, and MACD is also showing bullish momentum—but that’s exactly the typical profile of an overheated market. Trend indicators are inherently lagging; meanwhile, sentiment has already pushed RSI to the 94.6 high.
Don’t believe stories—watch the data. In this kind of position, bullish momentum is often the market’s final sprint rather than the starting point.
Derivative data also verifies this view.
Over the past 24 hours, trading volume is $20.93M and open interest is $5.13M. It surged by 24.4%—suggesting new money is chasing the price, not old positions are holding on.
Funding rate +0.0050% isn’t too extreme, but while bullish accounts make up 70%, the buy/sell bias of active trading is only 0.85—yet sell orders are actually more aggressive. More bulls doesn’t mean bulls are winning; this is a divergence signal.
Get the levels straight—no guessing, no gambling.
For the short side, first watch the focus zone from 0.07615 to 0.088557. It’s more suitable to wait for the pullback to face resistance and then confirm, not to stare at the current price.
If this range can withstand the pullback pressure, the bearish judgment remains valid.
If price rises back above 0.089, the invalidation reference is that line—don’t stubbornly hold the bearish thesis; just flip the page.
Watch the downside extension at 0.05565. If it breaks below with volume, then look toward support around 0.0509.
The conditions are laid out. Trigger it, then act—don’t sprint too early.
Let me say something not so nice: at the moment, a reverse signal isn’t obvious. On the indicator level, there’s no “hard” evidence yet that would flip the bulls.
But contract leverage is itself risk. RSI being high doesn’t mean a reversal will happen immediately. One pullback may be enough to overwhelm many high-leverage accounts.
This analysis isn’t to tell anyone to run; it’s to make clear the positioning and the trade-off you’re facing.
For reference only and does not constitute investment advice. Leverage is involved in contracts, and investing carries risk.
This article is assisted by the Musk xAI Grok model.
$C
#Contract View
$C bearish | Holds down 0.07615 - 0.088557 | Above 0.089 flip the page | See 0.05565
$C In this wave, I’m bearish.
Sell orders are dominant by 0.85. The RSI surged to 94.6. While it climbed 35.5%, open positions also jumped by 24.4%—putting these three together is the flavor of overheated crowding.
The pullback can’t break the pressure zone; this call holds.
The order book doesn’t lie—look at the technical structure.
Recent high 0.089, recent low 0.05565. The current price 0.07615 is still above the upper Bollinger Band 0.0674, clearly deviating from the midline 0.0591.
The Supertrend indicator points upward, and MACD is also showing bullish momentum—but that’s exactly the typical profile of an overheated market. Trend indicators are inherently lagging; meanwhile, sentiment has already pushed RSI to the 94.6 high.
Don’t believe stories—watch the data. In this kind of position, bullish momentum is often the market’s final sprint rather than the starting point.
Derivative data also verifies this view.
Over the past 24 hours, trading volume is $20.93M and open interest is $5.13M. It surged by 24.4%—suggesting new money is chasing the price, not old positions are holding on.
Funding rate +0.0050% isn’t too extreme, but while bullish accounts make up 70%, the buy/sell bias of active trading is only 0.85—yet sell orders are actually more aggressive. More bulls doesn’t mean bulls are winning; this is a divergence signal.
Get the levels straight—no guessing, no gambling.
For the short side, first watch the focus zone from 0.07615 to 0.088557. It’s more suitable to wait for the pullback to face resistance and then confirm, not to stare at the current price.
If this range can withstand the pullback pressure, the bearish judgment remains valid.
If price rises back above 0.089, the invalidation reference is that line—don’t stubbornly hold the bearish thesis; just flip the page.
Watch the downside extension at 0.05565. If it breaks below with volume, then look toward support around 0.0509.
The conditions are laid out. Trigger it, then act—don’t sprint too early.
Let me say something not so nice: at the moment, a reverse signal isn’t obvious. On the indicator level, there’s no “hard” evidence yet that would flip the bulls.
But contract leverage is itself risk. RSI being high doesn’t mean a reversal will happen immediately. One pullback may be enough to overwhelm many high-leverage accounts.
This analysis isn’t to tell anyone to run; it’s to make clear the positioning and the trade-off you’re facing.
For reference only and does not constitute investment advice. Leverage is involved in contracts, and investing carries risk.
This article is assisted by the Musk xAI Grok model.
$C
#Contract View