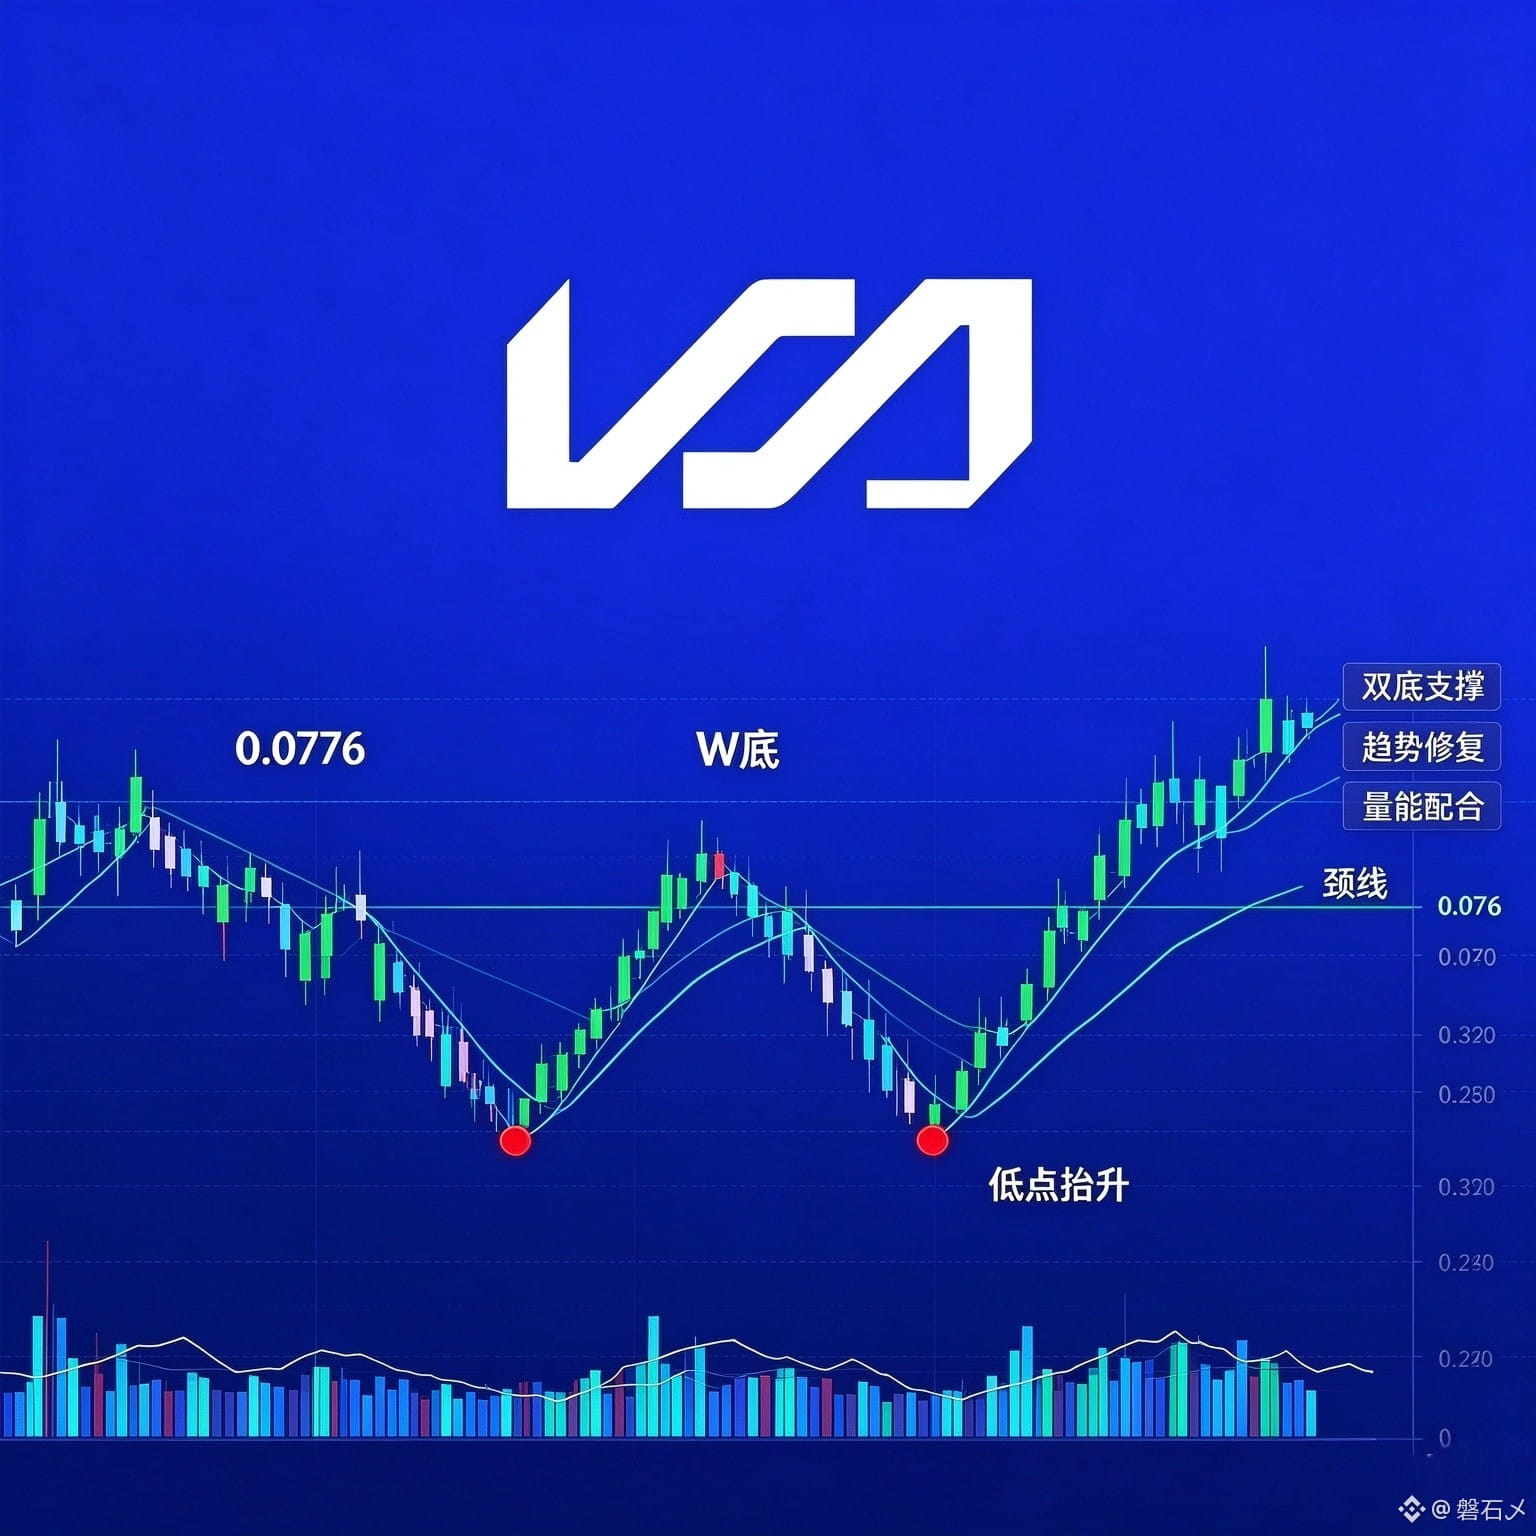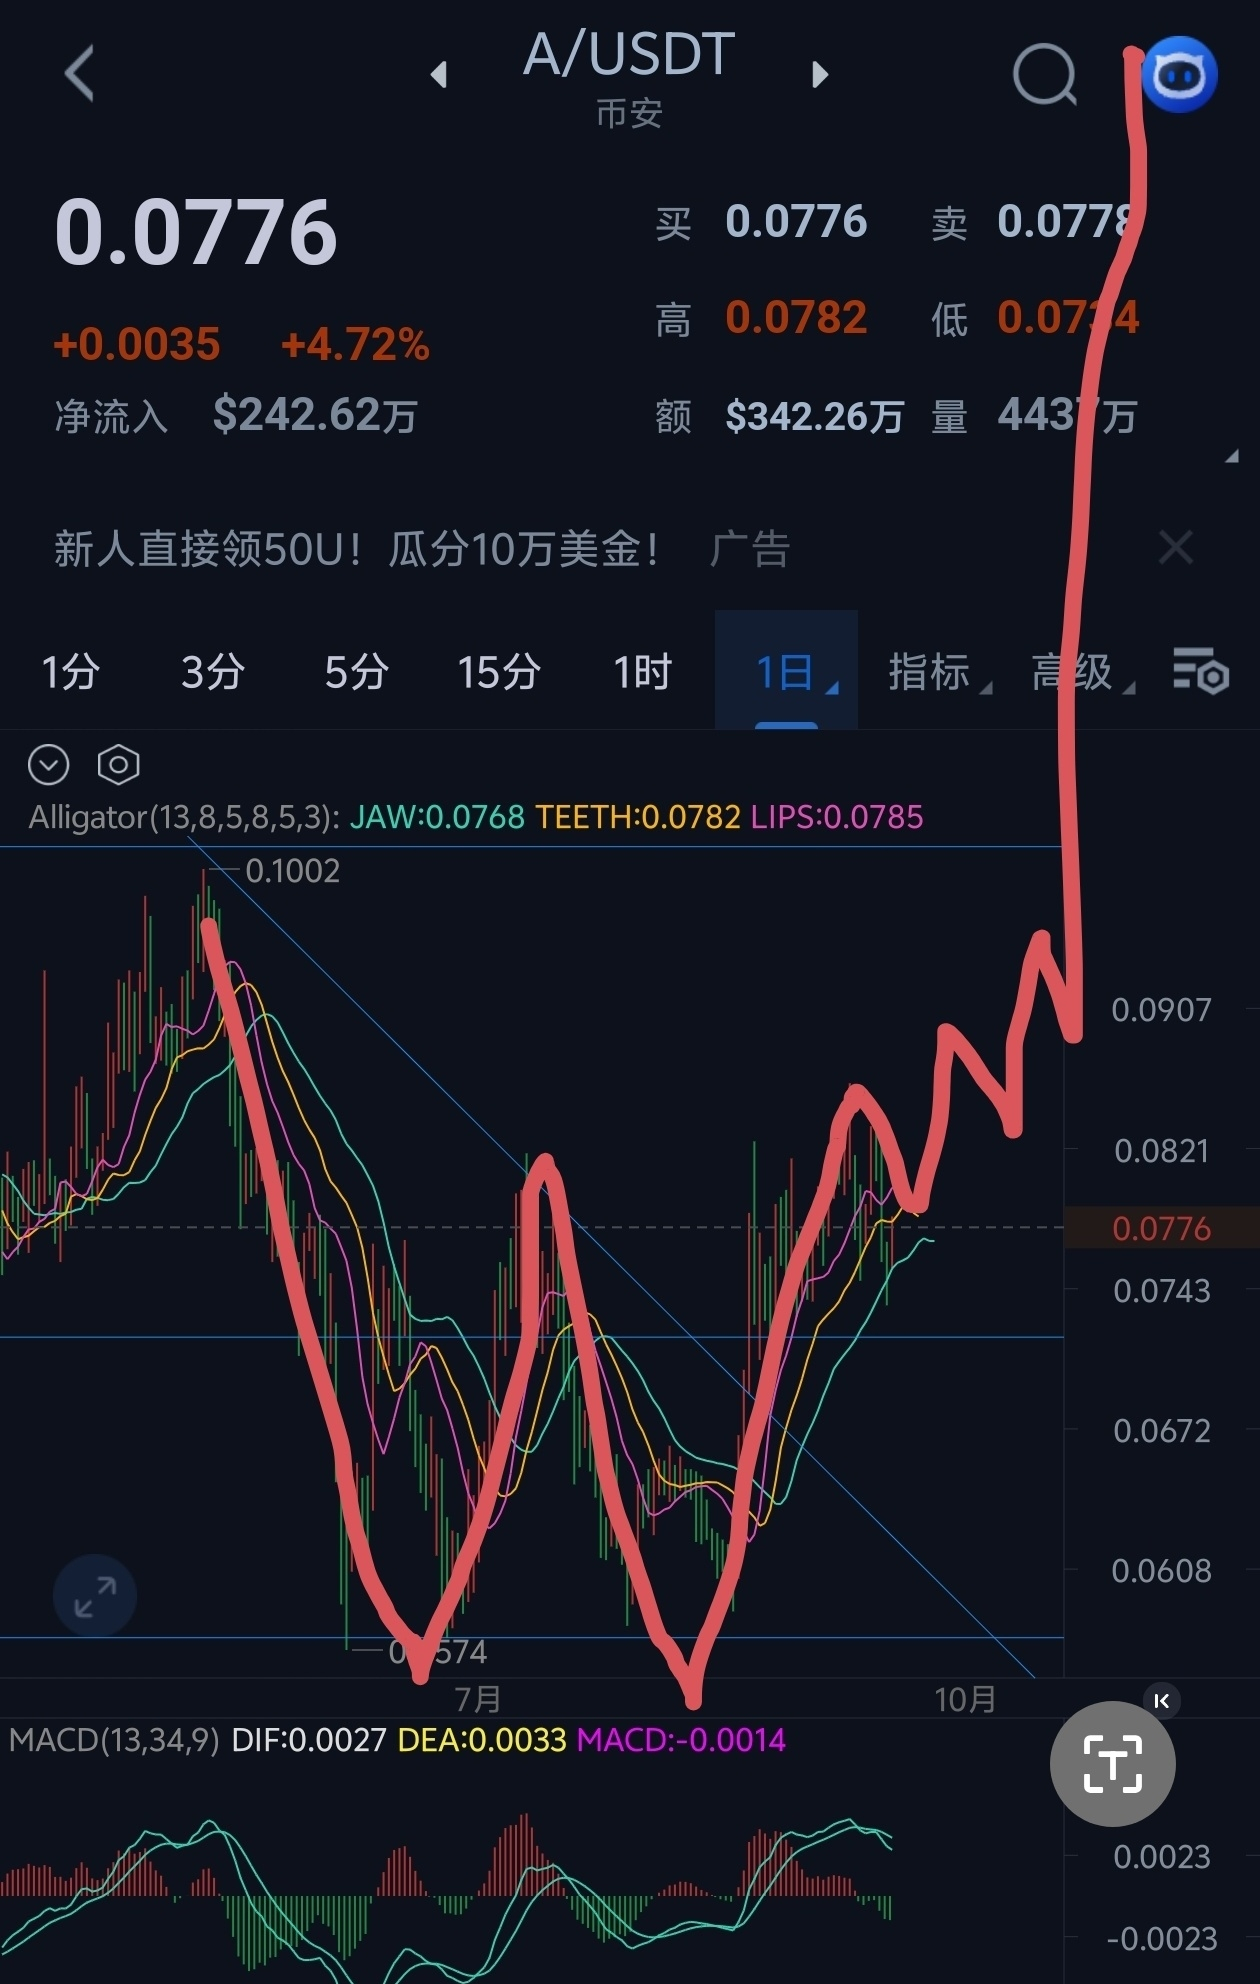
$A Daily chart shows a very standard W-bottom and double-bottom pattern:
1. First, two successive trough lows appear—two dips. The support below is strong; the price cannot break down, forming the two bottoms of the W;
2. The second bottom does not break below the previous low. The low is raised, indicating the bears’ strength is exhausted and buying demand below is strong enough to absorb;
3. After completing the two dips, the price rebounds upward and is currently breaking through the neckline resistance area—this is a classic bottom-reversal candlestick pattern.
In combination with the signals shown in the chart:
✅ W-bottom formed
✅ The Alligator indicator’s mouth gradually turns upward
✅ MACD bottoms turn upward—the bullish momentum is reviving
✅ Net capital inflow, with volume confirming
🛩️: ECFgroup
$A #Vaulta #eos
1. First, two successive trough lows appear—two dips. The support below is strong; the price cannot break down, forming the two bottoms of the W;
2. The second bottom does not break below the previous low. The low is raised, indicating the bears’ strength is exhausted and buying demand below is strong enough to absorb;
3. After completing the two dips, the price rebounds upward and is currently breaking through the neckline resistance area—this is a classic bottom-reversal candlestick pattern.
In combination with the signals shown in the chart:
✅ W-bottom formed
✅ The Alligator indicator’s mouth gradually turns upward
✅ MACD bottoms turn upward—the bullish momentum is reviving
✅ Net capital inflow, with volume confirming
🛩️: ECFgroup
$A #Vaulta #eos