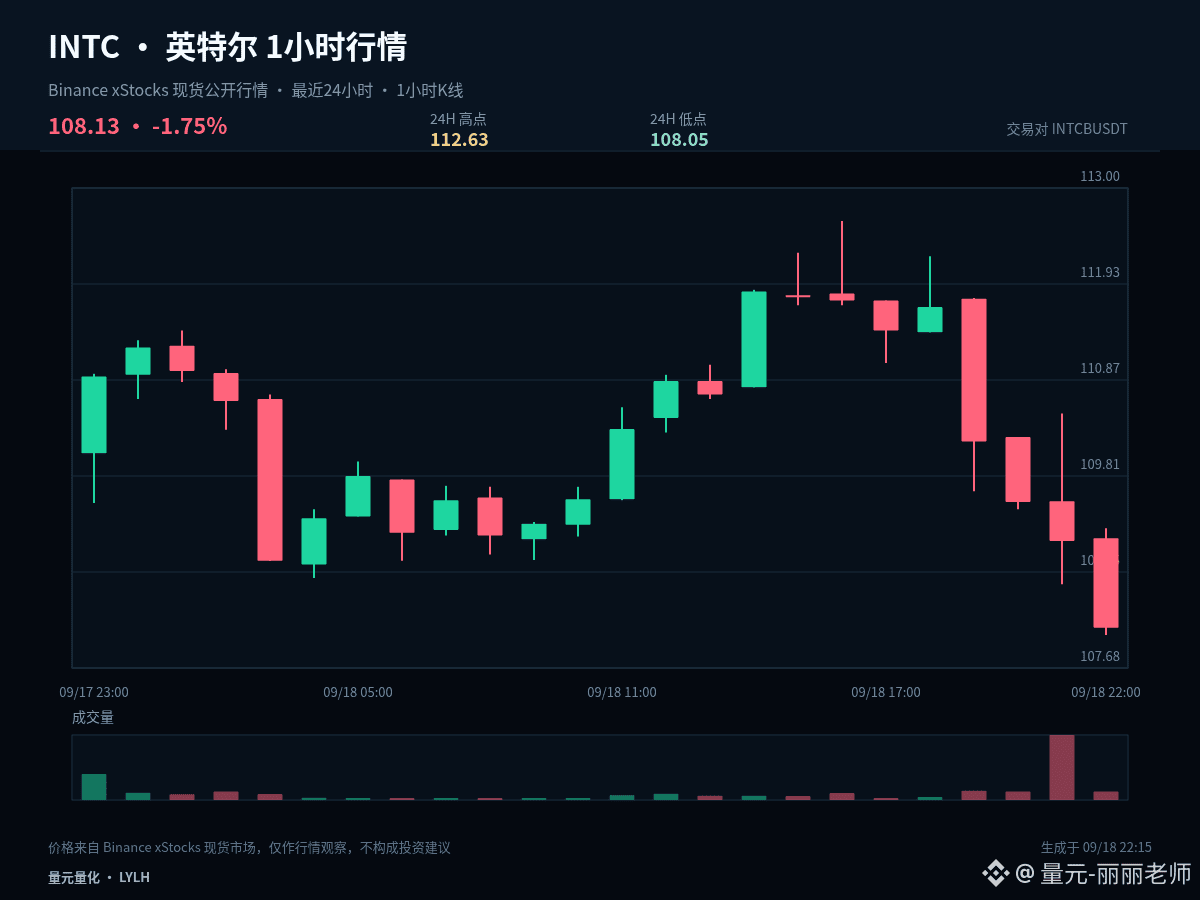
$INTCB #INTC Can this market move continue? It doesn’t depend on how much it has already risen beforehand; it depends on whether the trend can complete “impulse, consolidation, and then confirmation.” Current 1-hour change is -0.88%, and 24-hour change is -0.74%.
The current price is near the lower bound of the last 24 hours’ range: 1-hour -0.88%, 24-hour -0.74%. The key to analyzing the low isn’t trying to bottom early, but watching whether, after a break, the price can quickly reclaim. If it can be reclaimed, it indicates sell pressure is being absorbed. If it continues to linger below the lower bound, it means weakness hasn’t ended yet.
The first condition for an extension of the structure is that 110.34 is not effectively broken downward. The second condition is that the price can retest and regain 112.63. If, after the impulse, it stays for a long time below the midline, it suggests the active buying has weakened. If it further loses 108.05, then the original extension assumption needs to be cancelled.
My scenario analysis isn’t based on a single bet in one direction. A breakout above 112.63 and holding it means the upside space is reopened. A breakdown below 108.05 and failure to bounce back means the structure weakens further. If it trades between the two, then keep observing the closing performance on both sides of 110.34.
Existing positions can be handled in segments based on key levels, avoiding making all decisions at once. If you’re currently in cash, wait for breakout confirmation or for pullback stabilization. For US market instruments, also watch for volatility caused by trading-session transitions; your plan should be based on price conditions, not on emotions substituting for execution.
Risk control still comes before any conclusions: execute only when conditions are met, and reassess promptly if the price becomes invalid. The higher the volatility, the more restrained each single position should be. The above is a view based on the current 1-hour and 24-hour data; it does not constitute a promise of returns.
#ChainlinkPowersBottomlinePaymentPlatform
The current price is near the lower bound of the last 24 hours’ range: 1-hour -0.88%, 24-hour -0.74%. The key to analyzing the low isn’t trying to bottom early, but watching whether, after a break, the price can quickly reclaim. If it can be reclaimed, it indicates sell pressure is being absorbed. If it continues to linger below the lower bound, it means weakness hasn’t ended yet.
The first condition for an extension of the structure is that 110.34 is not effectively broken downward. The second condition is that the price can retest and regain 112.63. If, after the impulse, it stays for a long time below the midline, it suggests the active buying has weakened. If it further loses 108.05, then the original extension assumption needs to be cancelled.
My scenario analysis isn’t based on a single bet in one direction. A breakout above 112.63 and holding it means the upside space is reopened. A breakdown below 108.05 and failure to bounce back means the structure weakens further. If it trades between the two, then keep observing the closing performance on both sides of 110.34.
Existing positions can be handled in segments based on key levels, avoiding making all decisions at once. If you’re currently in cash, wait for breakout confirmation or for pullback stabilization. For US market instruments, also watch for volatility caused by trading-session transitions; your plan should be based on price conditions, not on emotions substituting for execution.
Risk control still comes before any conclusions: execute only when conditions are met, and reassess promptly if the price becomes invalid. The higher the volatility, the more restrained each single position should be. The above is a view based on the current 1-hour and 24-hour data; it does not constitute a promise of returns.
#ChainlinkPowersBottomlinePaymentPlatform