$0.21 ARB—are you chasing it now?
First, look at the surface: everyone online is shouting “L2 kings are back.”
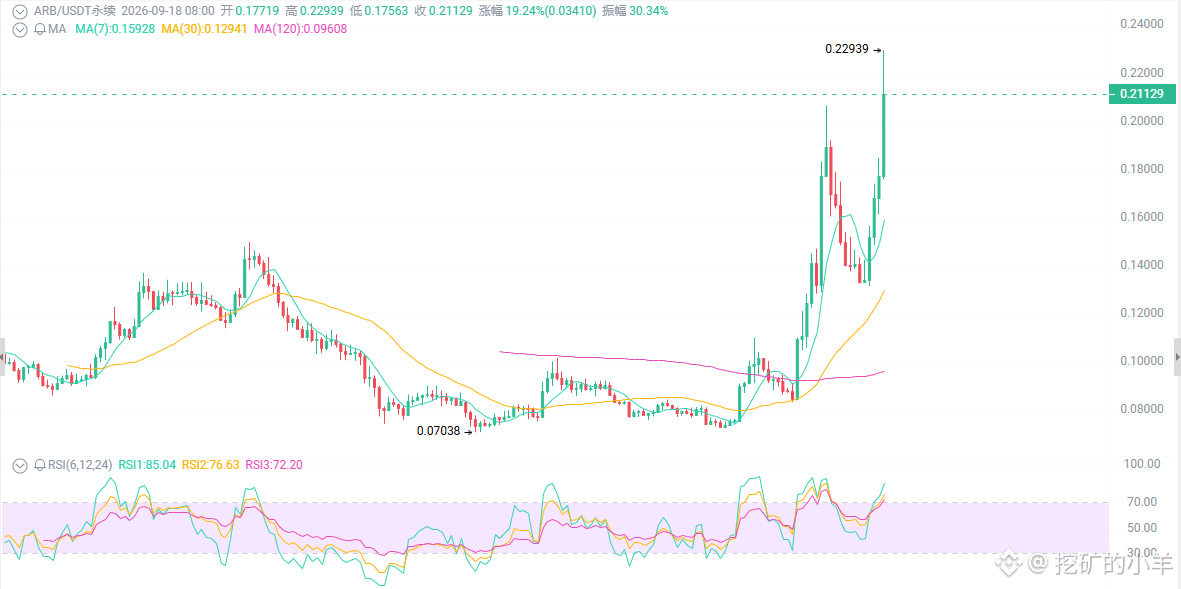
In mid-September it was still pretending dead at around $0.13–$0.14; then in a single week it surged straight to $0.229—up 70%. The daily chart closed above the 50/100/200 EMA, the weekly chart flipped bullish, and volume exploded to record highs. The trend is bullish, but the RSI is already up at 68–78—overbought alarm is ringing.
First thing: this isn’t an “air pump.” Something real actually landed.
On Thursday, the SEC granted a 5-year Innovation Exemption, allowing tokenized securities to be traded in compliant venues. The market immediately treats Arbitrum as a major beneficiary chain.
On Arbitrum, tokenized fund size hit a record—at one point nearing $980M.
Robinhood Chain (Arbitrum Orbit) monthly revenue run-rate is about $5M, roughly 5x what it was before launch.
AEP profit-sharing has already started paying rent to the DAO.
Second thing: you need to understand that what’s rising is expectation—not performance.
ARB circulating supply is 6.79B out of a total 10B, with the bulk of unlocks scheduled for March 2027.
Market cap is only $1.4B right now—still 91% away from the all-time high of $2.39.
From $0.13 to $0.21 in a week (70%): do you call it “price discovery,” or “news racing ahead”?
On-chain TVL is $1.39B, RWA is close to $900M, and DAO revenue is $6.19M—fundamentals are improving, but $0.21 has already priced in a big chunk of these expectations.
Third thing: the technical picture tells you this is the climax zone, not the launch zone.
Good signals: weekly flipped bullish; daily is above all moving averages. After a higher-lows base, it accelerated into a breakout—not a slow grind designed to lure longs.
Bad signals: RSI is 68–78 (overbought). Price is far above the moving averages (the MAs are still around $0.11–$0.13), so mean reversion pressure is huge. Today’s $0.229 printed a long upper wick—classic “spike up on news, then fade” behavior.
The direction is fine, but the position is uncomfortable.
Trading strategy
If you already hold longs:
Trim 30%–50% around $0.21 to move your cost into a safer range. Sell another tranche in the $0.228–$0.232 area. If it puts up volume and holds above $0.24, then reassess for $0.27. If the 4H closes below $0.198, cut down to a light position; if the daily closes below $0.17, exit the trend trade.
If you’re flat and want to go long:
Wait for one of two structures:
Strong pullback to $0.198–$0.205 with decreasing volume and then stabilization. Stop-loss $0.188. Targets $0.228/$0.24.
Deep retrace to $0.178–$0.185. Stop-loss $0.168. Target: breakout above the prior high.
If you want to short / hedge:
Only suitable for short-term.
If the rebound from $0.226–$0.230 can’t break through, you can lightly short with a stop-loss at $0.236; targets $0.205/$0.185. If it puts up volume and holds above $0.232 immediately admit the mistake—because the news cycle is still simmering, a hard short can get squeezed.
First, look at the surface: everyone online is shouting “L2 kings are back.”
In mid-September it was still pretending dead at around $0.13–$0.14; then in a single week it surged straight to $0.229—up 70%. The daily chart closed above the 50/100/200 EMA, the weekly chart flipped bullish, and volume exploded to record highs. The trend is bullish, but the RSI is already up at 68–78—overbought alarm is ringing.
First thing: this isn’t an “air pump.” Something real actually landed.
On Thursday, the SEC granted a 5-year Innovation Exemption, allowing tokenized securities to be traded in compliant venues. The market immediately treats Arbitrum as a major beneficiary chain.
On Arbitrum, tokenized fund size hit a record—at one point nearing $980M.
Robinhood Chain (Arbitrum Orbit) monthly revenue run-rate is about $5M, roughly 5x what it was before launch.
AEP profit-sharing has already started paying rent to the DAO.
Second thing: you need to understand that what’s rising is expectation—not performance.
ARB circulating supply is 6.79B out of a total 10B, with the bulk of unlocks scheduled for March 2027.
Market cap is only $1.4B right now—still 91% away from the all-time high of $2.39.
From $0.13 to $0.21 in a week (70%): do you call it “price discovery,” or “news racing ahead”?
On-chain TVL is $1.39B, RWA is close to $900M, and DAO revenue is $6.19M—fundamentals are improving, but $0.21 has already priced in a big chunk of these expectations.
Third thing: the technical picture tells you this is the climax zone, not the launch zone.
Good signals: weekly flipped bullish; daily is above all moving averages. After a higher-lows base, it accelerated into a breakout—not a slow grind designed to lure longs.
Bad signals: RSI is 68–78 (overbought). Price is far above the moving averages (the MAs are still around $0.11–$0.13), so mean reversion pressure is huge. Today’s $0.229 printed a long upper wick—classic “spike up on news, then fade” behavior.
The direction is fine, but the position is uncomfortable.
Trading strategy
If you already hold longs:
Trim 30%–50% around $0.21 to move your cost into a safer range. Sell another tranche in the $0.228–$0.232 area. If it puts up volume and holds above $0.24, then reassess for $0.27. If the 4H closes below $0.198, cut down to a light position; if the daily closes below $0.17, exit the trend trade.
If you’re flat and want to go long:
Wait for one of two structures:
Strong pullback to $0.198–$0.205 with decreasing volume and then stabilization. Stop-loss $0.188. Targets $0.228/$0.24.
Deep retrace to $0.178–$0.185. Stop-loss $0.168. Target: breakout above the prior high.
If you want to short / hedge:
Only suitable for short-term.
If the rebound from $0.226–$0.230 can’t break through, you can lightly short with a stop-loss at $0.236; targets $0.205/$0.185. If it puts up volume and holds above $0.232 immediately admit the mistake—because the news cycle is still simmering, a hard short can get squeezed.