



Many friends who just came to the Square to post content or start livestreams often feel confused: "I’ve posted an article and livestreamed, but where do I actually go to check the data? What do all those metrics in the backend mean?"
The biggest taboo in creating is "blind men feeling an elephant." Learn to read the Creator Center data dashboard—it's the only objective basis for judging whether your content is good and how to optimize your livestreaming rhythm.
Let’s compare directly with Binance Square’s official backend today. I’ll walk you step by step through where you can find and how to interpret the overall account dashboard data and the independent data for individual pieces of content/livestreams!
1. How to access the Creator Center data dashboard
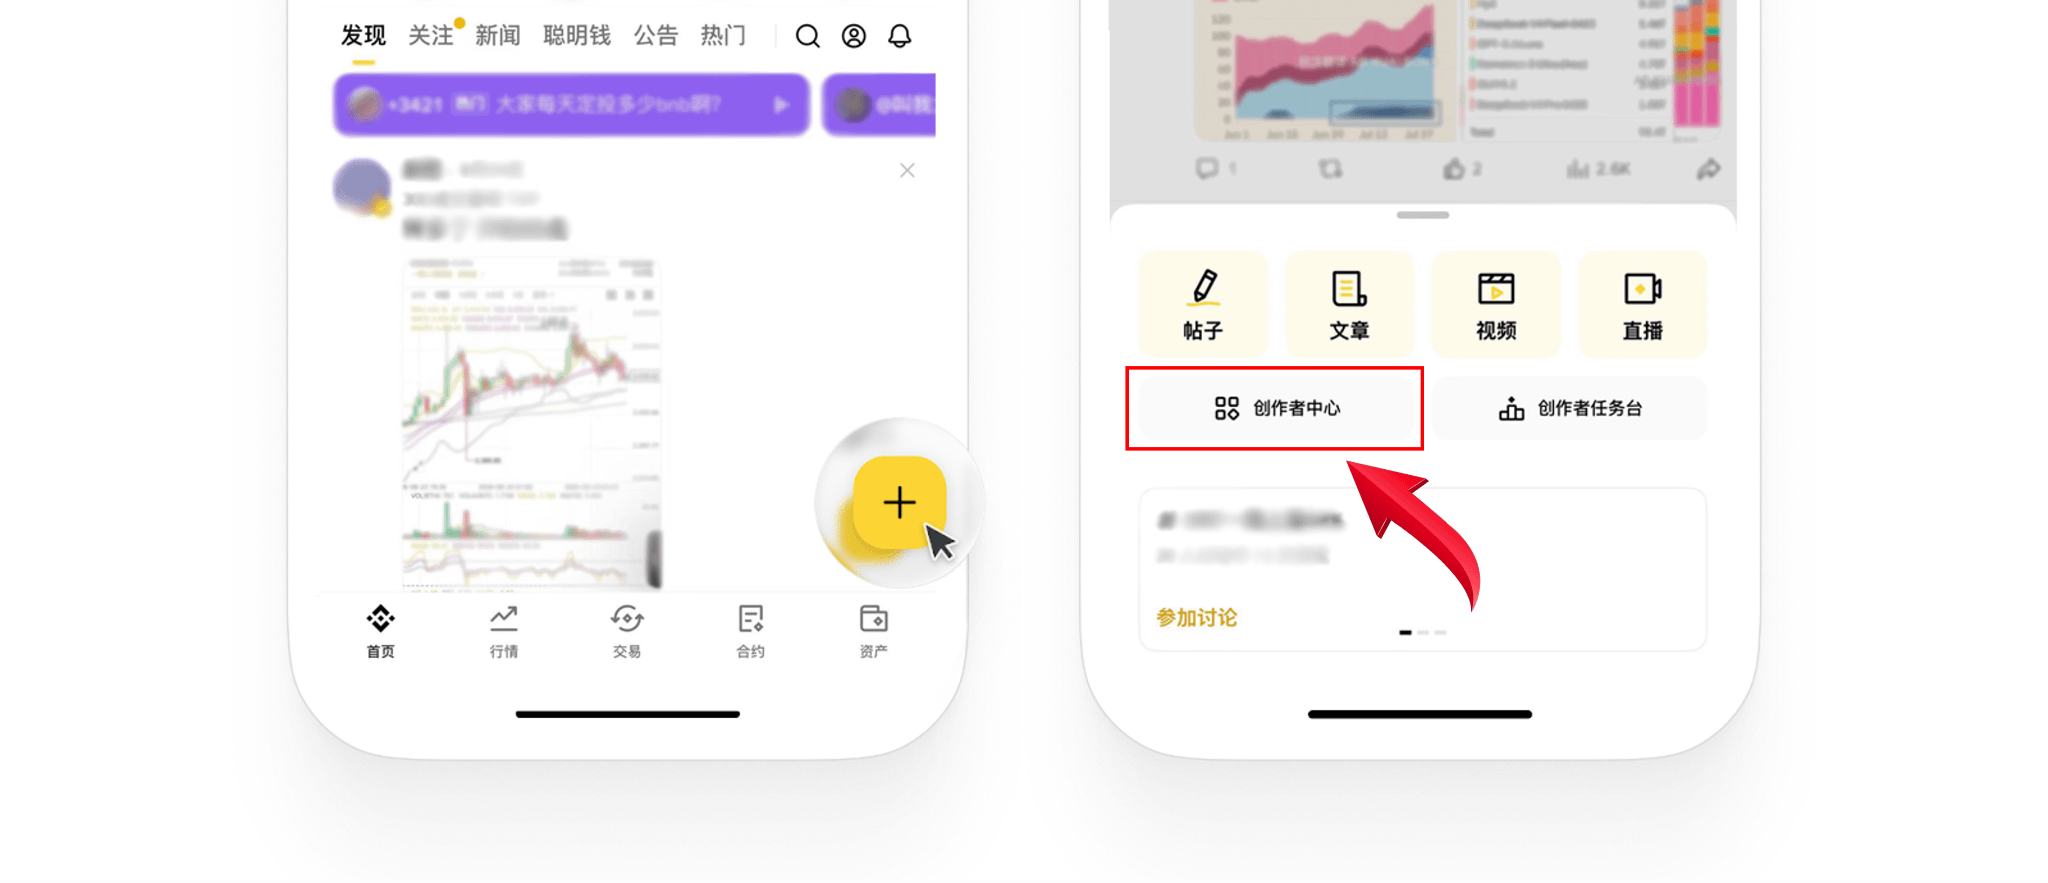
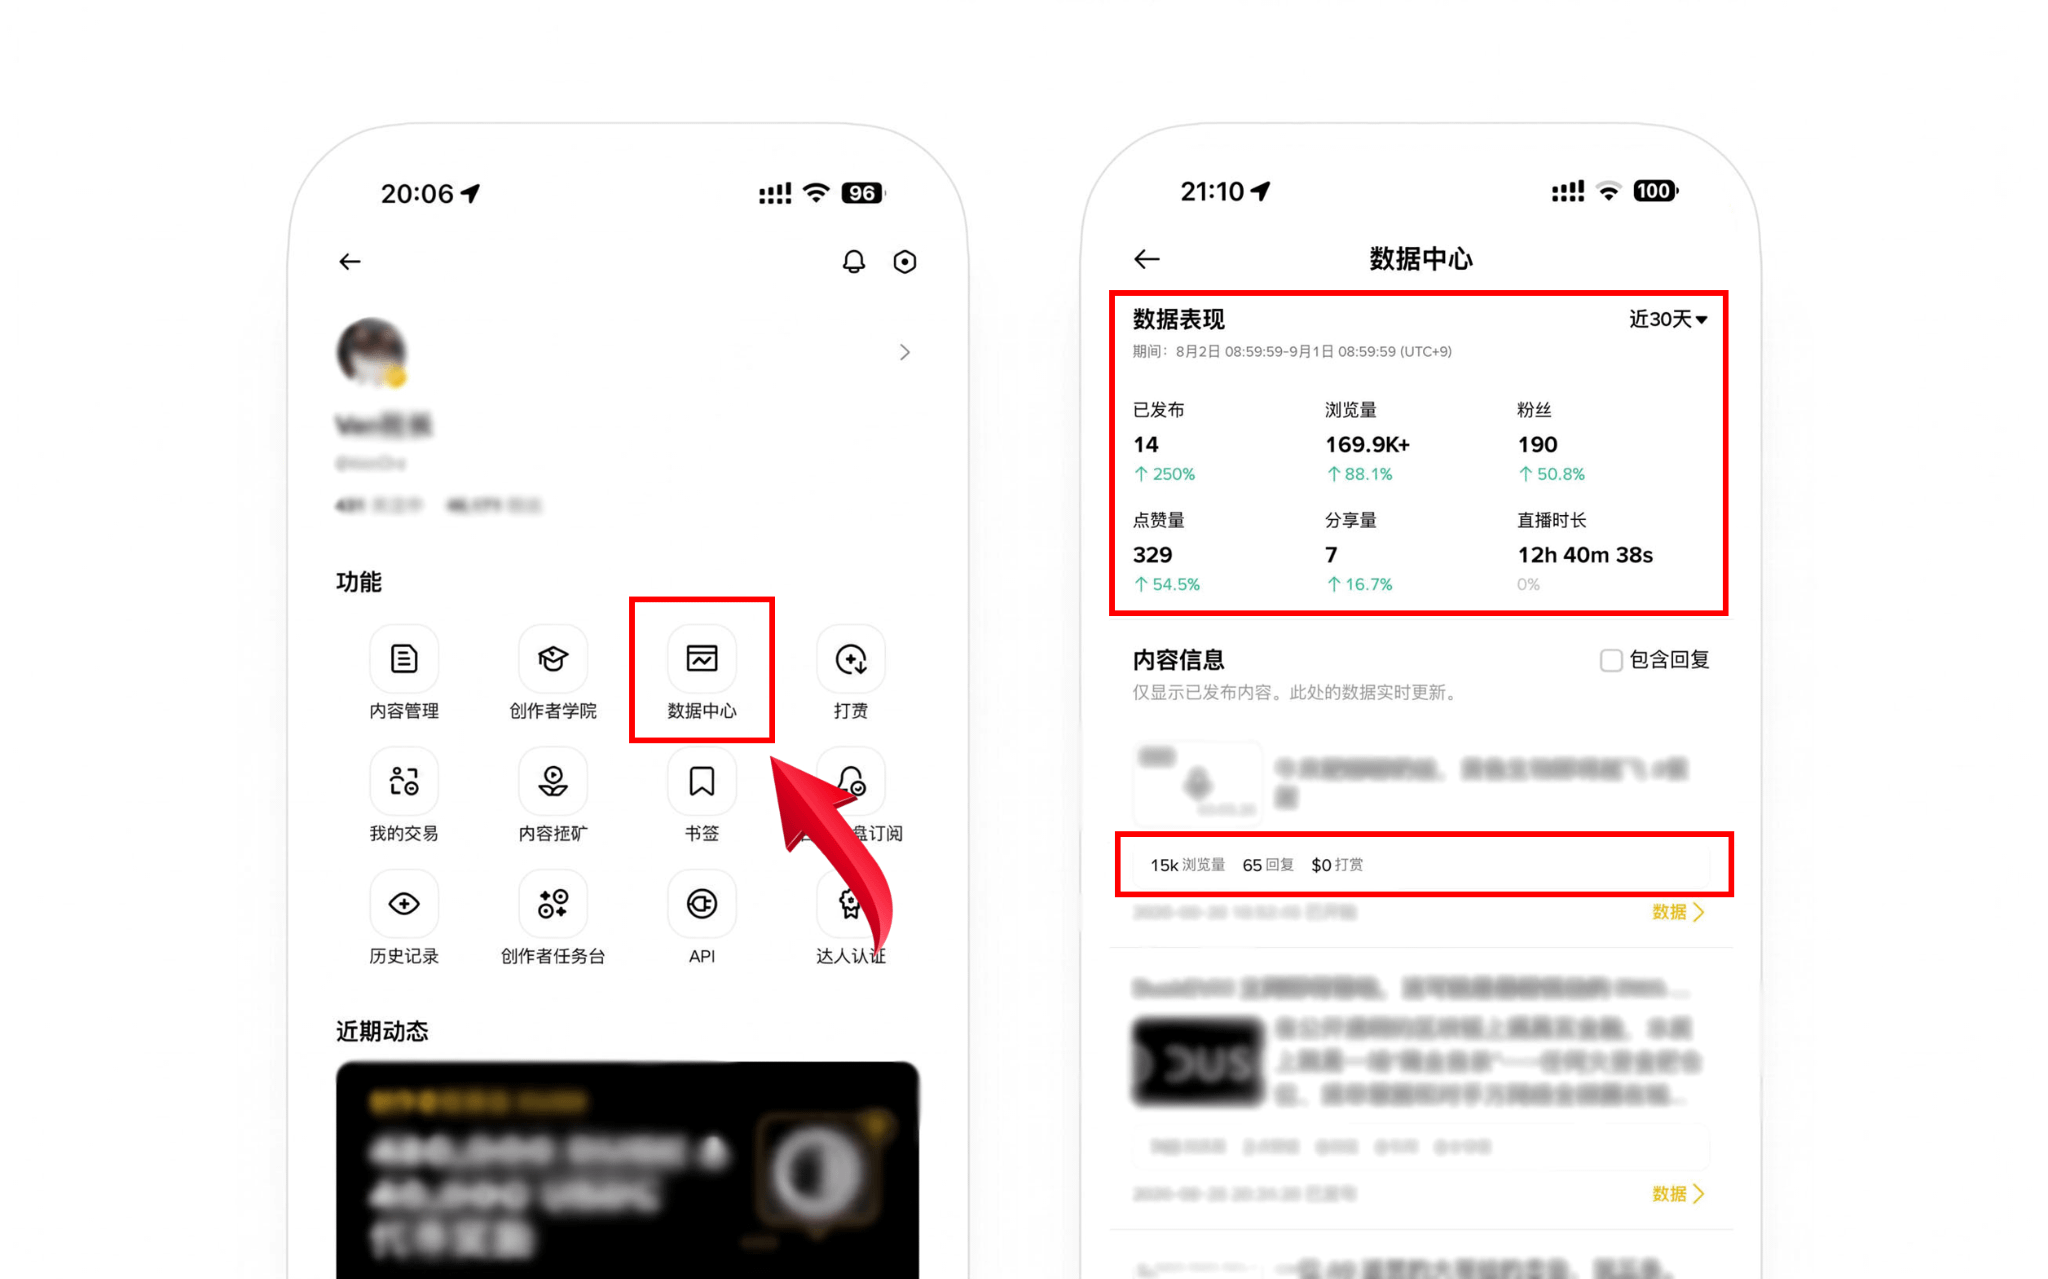
App (mobile): Open the Binance app homepage → swipe down to enter the [Plaza] section → click the yellow plus button at the bottom-right → select [Creator Center] → go to [Data Center].
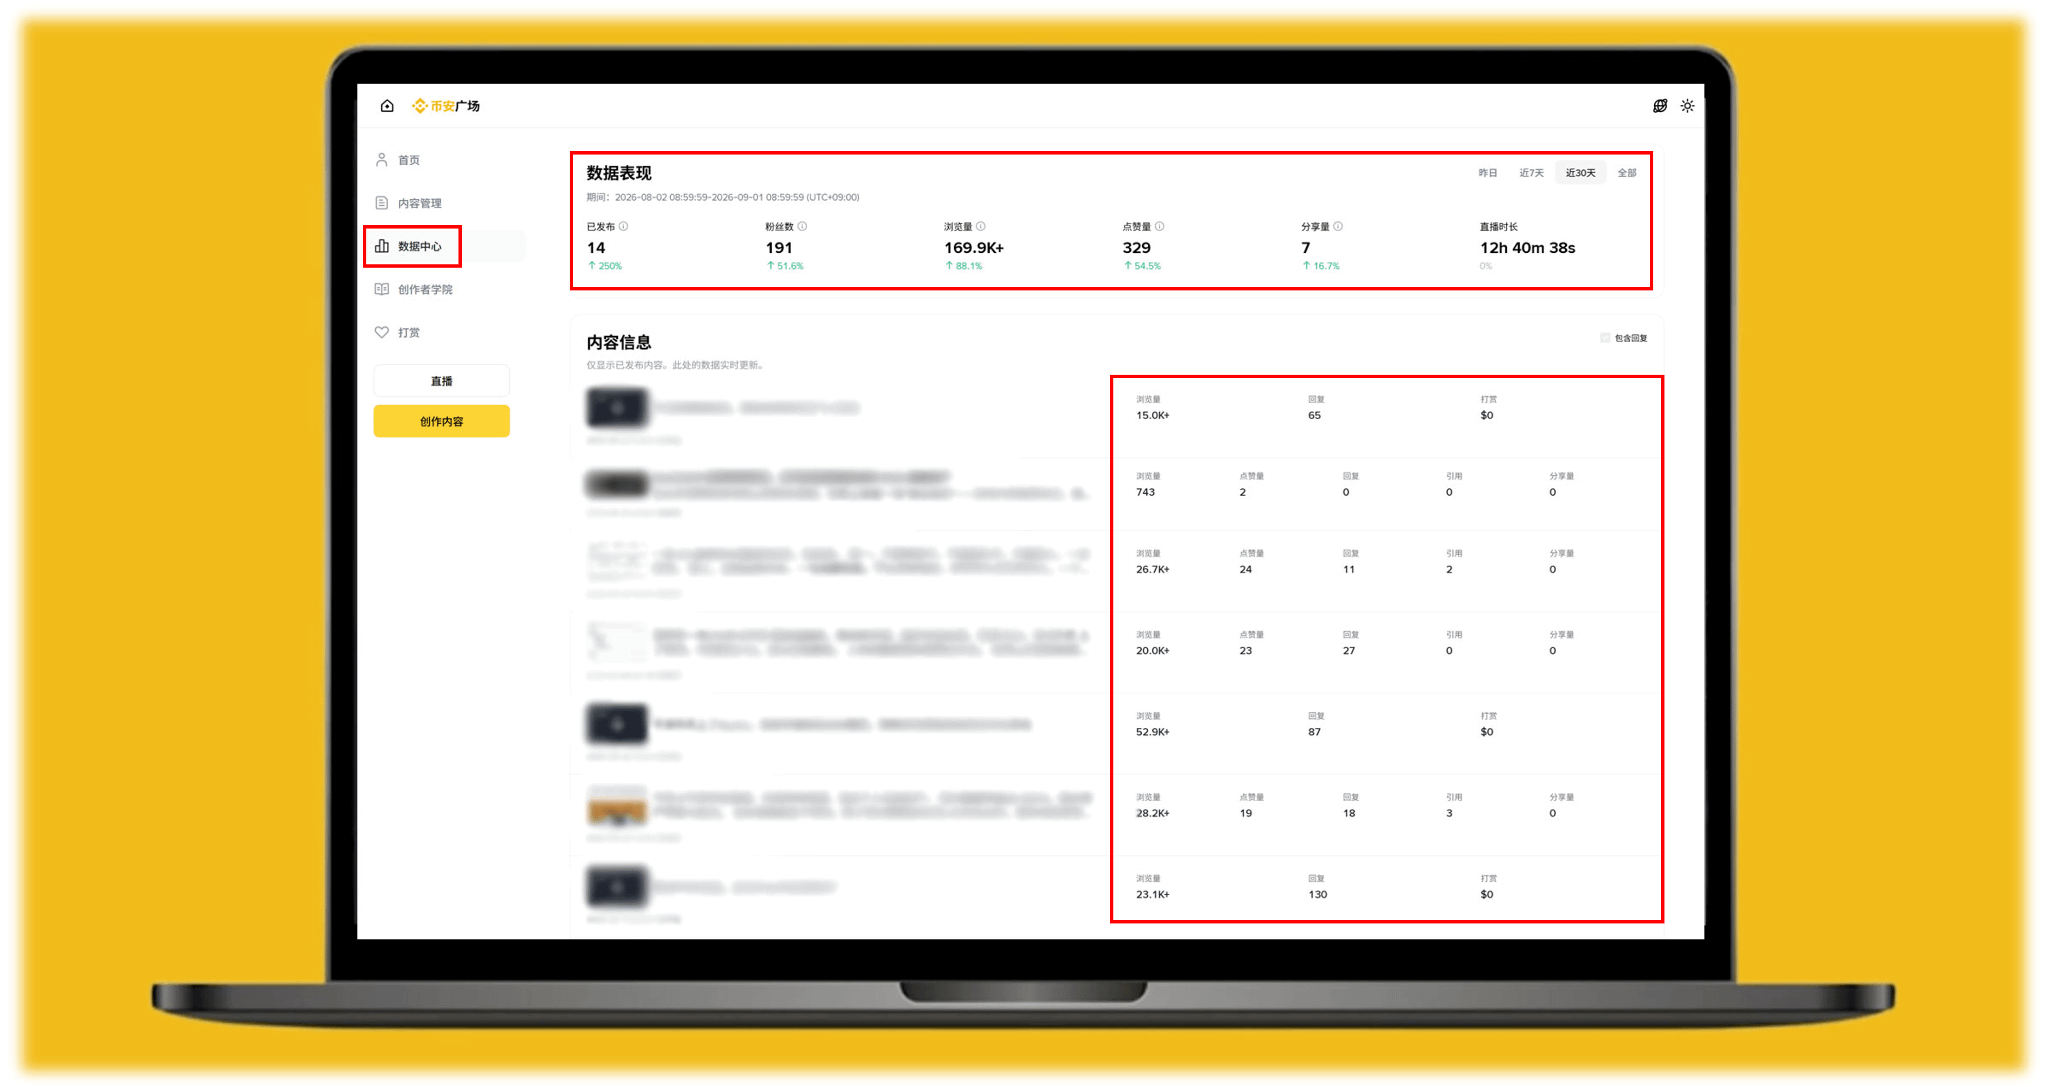
Web (desktop): Log in to the official website to enter the Plaza channel → click your profile picture to go to [Creator Center] (backend) → in the left navigation bar, go to Data Center to view it.
2. Overall account dashboard data: understand the overall growth trend clearly
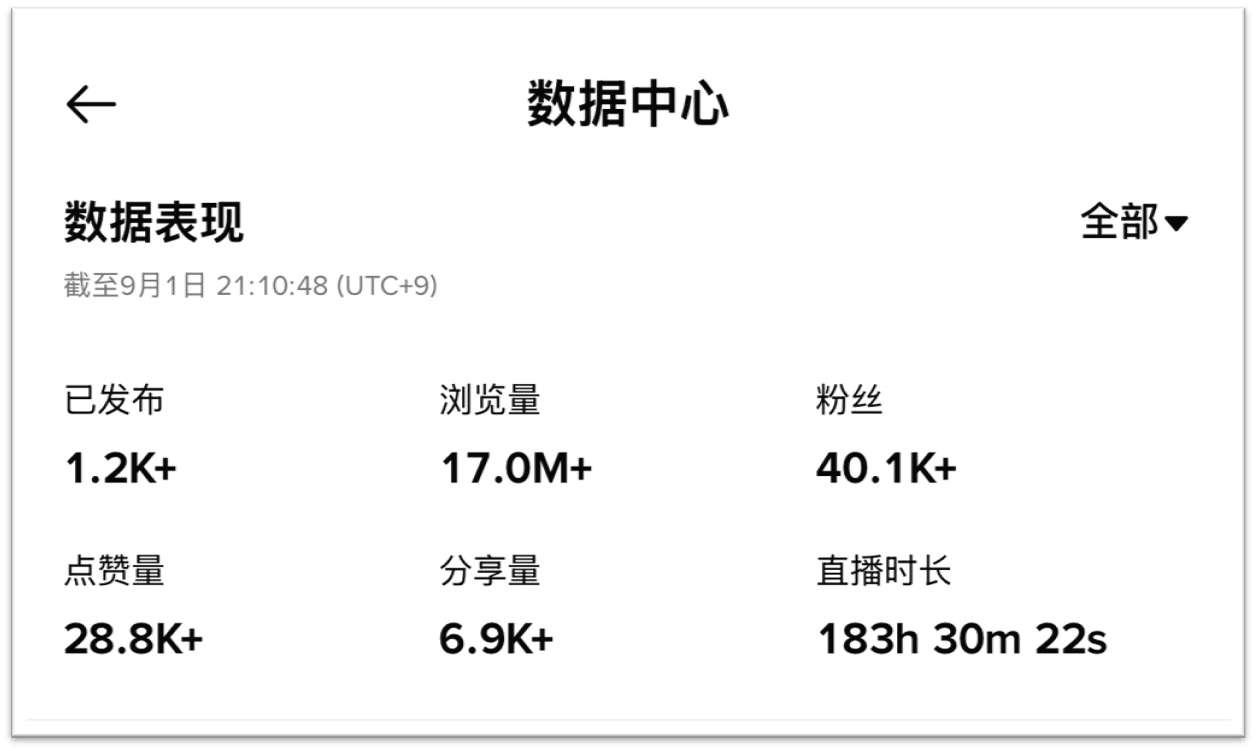
In the Creator Center’s [Data Performance] section, the system supports overall reviews across four time dimensions: yesterday / past 7 days / past 30 days / all time:
The meaning of the core dashboard metrics and operational references have been published. Total number of long-form articles, short posts, or updates you published during this cycle. Fan count: the change in your current account’s follower number during the cycle (e.g., net increase yesterday). Views: the total number of times all content under your name was clicked and viewed by readers during the cycle. Likes/Shares: the total likes and shares your account’s full content received during the cycle. Live stream duration: the total cumulative time you went live during the cycle.
3. Independent data for a single post: measuring the quality of text and graphics
In addition to the overall dashboard overview, the backend will also generate an independent, in-depth data dashboard for each piece of text-and-graphics content you publish:
Go to [Content Management], click “Data Analysis” for the specific article, and focus on the following dimensions:
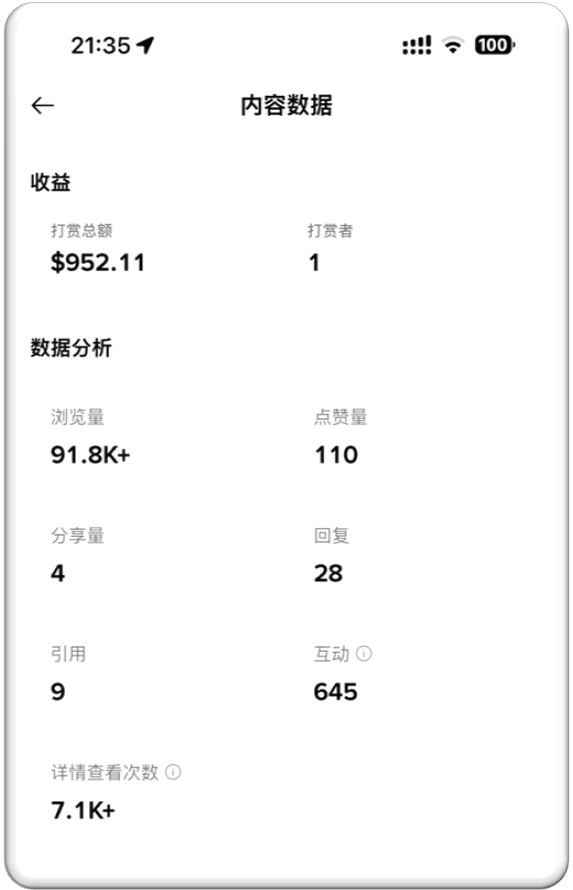
Revenue module:
Total tips & tippers: See readers’ real-money support for your post.
Communication and engagement data:
Views: the actual number of times readers entered and read this content.
Detail view count: in-depth actions where readers click to expand the article and view details.
Engagement volume: comprehensive statistics (including profile clicks, likes, replies, quotes, shares, etc.).
4. Dual live data panels: real-time battle report right after you go off-air + in-depth review in the backend
Unlike live streaming and other text/graphic content, the backend provides two ways to view: real-time settlement and backend summary.
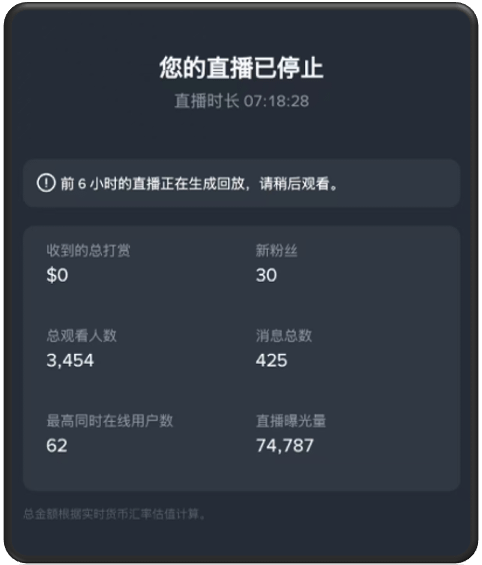
1. Real-time battle report: the “battle report panel” that pops up immediately after you go off-air. The moment you click “End Live,” the system will instantly display a real-time summary page: [Your live stream has stopped], presenting your core results for this session right away:
Live duration: the specific time length of this continuous live session.
Total tips received: the real-time converted value of gifts sent by viewers in this session (USD valuation).
New followers: the number of new followers who directly clicked to follow you during the entire live session.
Total viewers: the total number of unique audiences who entered and exited the live room.
Total messages: the total number of all on-screen banner interactions and chat messages in the public screen.
Highest simultaneous online users: the peak highest value of the number of users online at the same time during this live session, when popularity was highest.
Live exposure count: the total number of times the system displayed you to users in the feed or live recommendation plaza.
Note: At the start of the live stream, you can choose whether to enable “Generate live replay.” If enabled, the system will automatically generate replay videos for the first 6 hours. If the live session is longer than 6 hours, only the first 6 hours will be kept. You can later extract video recording snippets in the Creator Center → Content Management → Live backend.
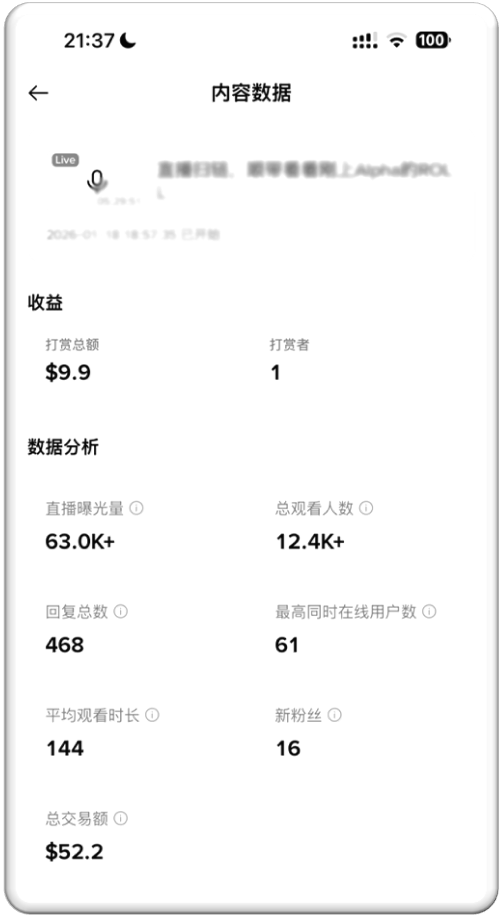
2. Creator Center [Live Data]: After you go off-air, if you want to review again, you can retrieve historical records anytime in the Creator Center. In addition to the real-time data above, the backend will also add average watch time (to measure audience stickiness) and total transaction amount (actual conversions generated during the live session through recommended coin leads).
Single live session independent data dashboard
Go to [Live Center] to view the single-session review data:
Revenue module:
Total tips & tippers: the amount and number of times viewers in this live room sent gifts.
Traffic and popularity metrics:
Live exposure count: the total number of times the system recommended and displayed you to users in the feed or live plaza.
Total viewers: the number of people who actually entered the live room.
Highest simultaneous online users: the peak value of popularity during this live session.
Average watch time: the average duration viewers stay in the live room, measuring how engaging the live content is.
Engagement and conversion metrics:
Total replies: the number of on-screen chat interaction banner messages.
New followers: the number of new follows your live session directly brought you.
Total transaction amount: the actual conversions generated during the live session through recommended coin leads.
5. 3 practical details when checking data
Screenshot the shut-down data first: the real-time panel that pops up right after you go off-air is the most direct feedback. It’s recommended to develop the habit of quick screenshots to make it easier to compare the performance of different live time slots (e.g., morning vs. late night).
Time zone and settlement time: the top of the dashboard data shows the statistics cycle (settled by standard UTC time). Daily data updates are usually completed at 00:00 in the UTC+0 time zone.
Transaction amount indicator is delayed: during a single live session, the total transaction amount completed by users through the live-room transaction feature. (Updated on T+1 day after the live ends; typically updated about 48 hours after the live ends. If you just posted and it shows “insufficient data,” that’s normal.)
Live streaming is all about interaction and retention: when doing live sweep (scanning links) or monitoring transactions, don’t only look at exposure count. Focus on average watch time and total reply count. The higher the engagement activity (banner activity), the more likely the live room will be pushed to the plaza’s live recommendation feed by the system.
Once you understand the exact locations and meanings of these metrics, you won’t feel lost when checking your data in the backend anymore.