📊 TECHNICAL MONITORING — POSSIBLE REVERSAL
📌 OBSERVED DATA
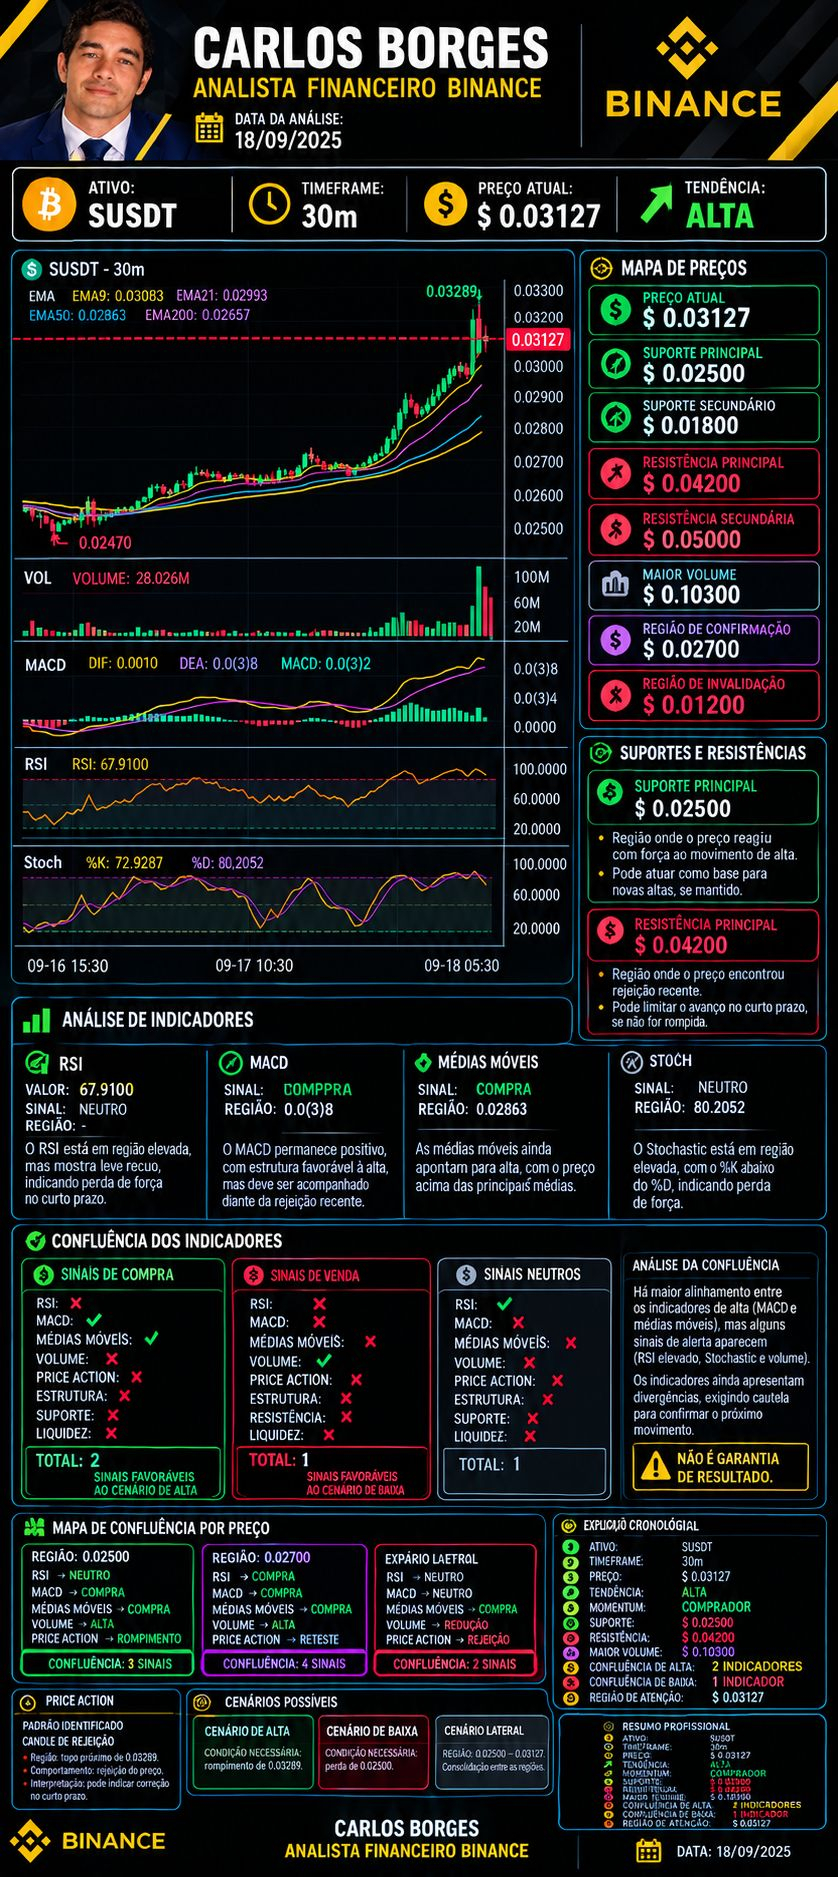
In the 30-minute chart, the price shows a strong appreciation, moving out of the 0.02470 area and advancing to a visible high near 0.03289. After reaching this region, there was rejection at the top and a pullback to approximately 0.03127.
The recent move was accompanied by a sharp increase in volume, especially during the advance and in the top region.
🔎 SIGNS TO MONITOR
RSI: 67.91 — remains in an elevated area, but shows a pullback after the upward move.
Stochastic: %K 72.9287 and %D 80.2052 — both in an elevated area, with %K below %D, indicating a loss of strength in the short term.
MACD: positive, with DIF 0.0010, DEA 0.0038, and MACD 0.0032, keeping a structure favorable to the uptrend, though it should be watched given the recent rejection.
Moving averages: EMA9 0.03083, EMA21 0.02993, EMA50 0.02863, and EMA200 0.02657. The price is still above the main moving averages, maintaining the bullish structure observed.
Volume: there was a very expressive expansion during the recent move, followed by a sell reaction at the top.
⚠️ POSSIBLE REVERSAL — NOT YET CONFIRMED
📊 Technical interpretation:
The set indicates a loss of strength after a strong extension of the rally, mainly due to rejection near 0.03289, the RSI pullback, weakening of the Stochastic, and a significant increase in volume in the top region.
However, this does not confirm a reversal. The structure still remains predominantly bullish as long as the price continues to hold above the moving averages and does not produce a clear sequence of lower lows.
🎯 WHAT TO WATCH
🟢 Continuation of the uptrend: recovery of buying strength and return to the region of the high near 0.03289.
🔴 Reversal gaining confirmation: progressive loss of nearby support regions around the moving averages, accompanied by an increase in selling volume and the formation of lower highs and lower lows.
📌 OBSERVED DATA
In the 30-minute chart, the price shows a strong appreciation, moving out of the 0.02470 area and advancing to a visible high near 0.03289. After reaching this region, there was rejection at the top and a pullback to approximately 0.03127.
The recent move was accompanied by a sharp increase in volume, especially during the advance and in the top region.
🔎 SIGNS TO MONITOR
RSI: 67.91 — remains in an elevated area, but shows a pullback after the upward move.
Stochastic: %K 72.9287 and %D 80.2052 — both in an elevated area, with %K below %D, indicating a loss of strength in the short term.
MACD: positive, with DIF 0.0010, DEA 0.0038, and MACD 0.0032, keeping a structure favorable to the uptrend, though it should be watched given the recent rejection.
Moving averages: EMA9 0.03083, EMA21 0.02993, EMA50 0.02863, and EMA200 0.02657. The price is still above the main moving averages, maintaining the bullish structure observed.
Volume: there was a very expressive expansion during the recent move, followed by a sell reaction at the top.
⚠️ POSSIBLE REVERSAL — NOT YET CONFIRMED
📊 Technical interpretation:
The set indicates a loss of strength after a strong extension of the rally, mainly due to rejection near 0.03289, the RSI pullback, weakening of the Stochastic, and a significant increase in volume in the top region.
However, this does not confirm a reversal. The structure still remains predominantly bullish as long as the price continues to hold above the moving averages and does not produce a clear sequence of lower lows.
🎯 WHAT TO WATCH
🟢 Continuation of the uptrend: recovery of buying strength and return to the region of the high near 0.03289.
🔴 Reversal gaining confirmation: progressive loss of nearby support regions around the moving averages, accompanied by an increase in selling volume and the formation of lower highs and lower lows.