📊 MONITORING A POSSIBLE REVERSAL — SUPERUSDT 30M
OBSERVED DATA:
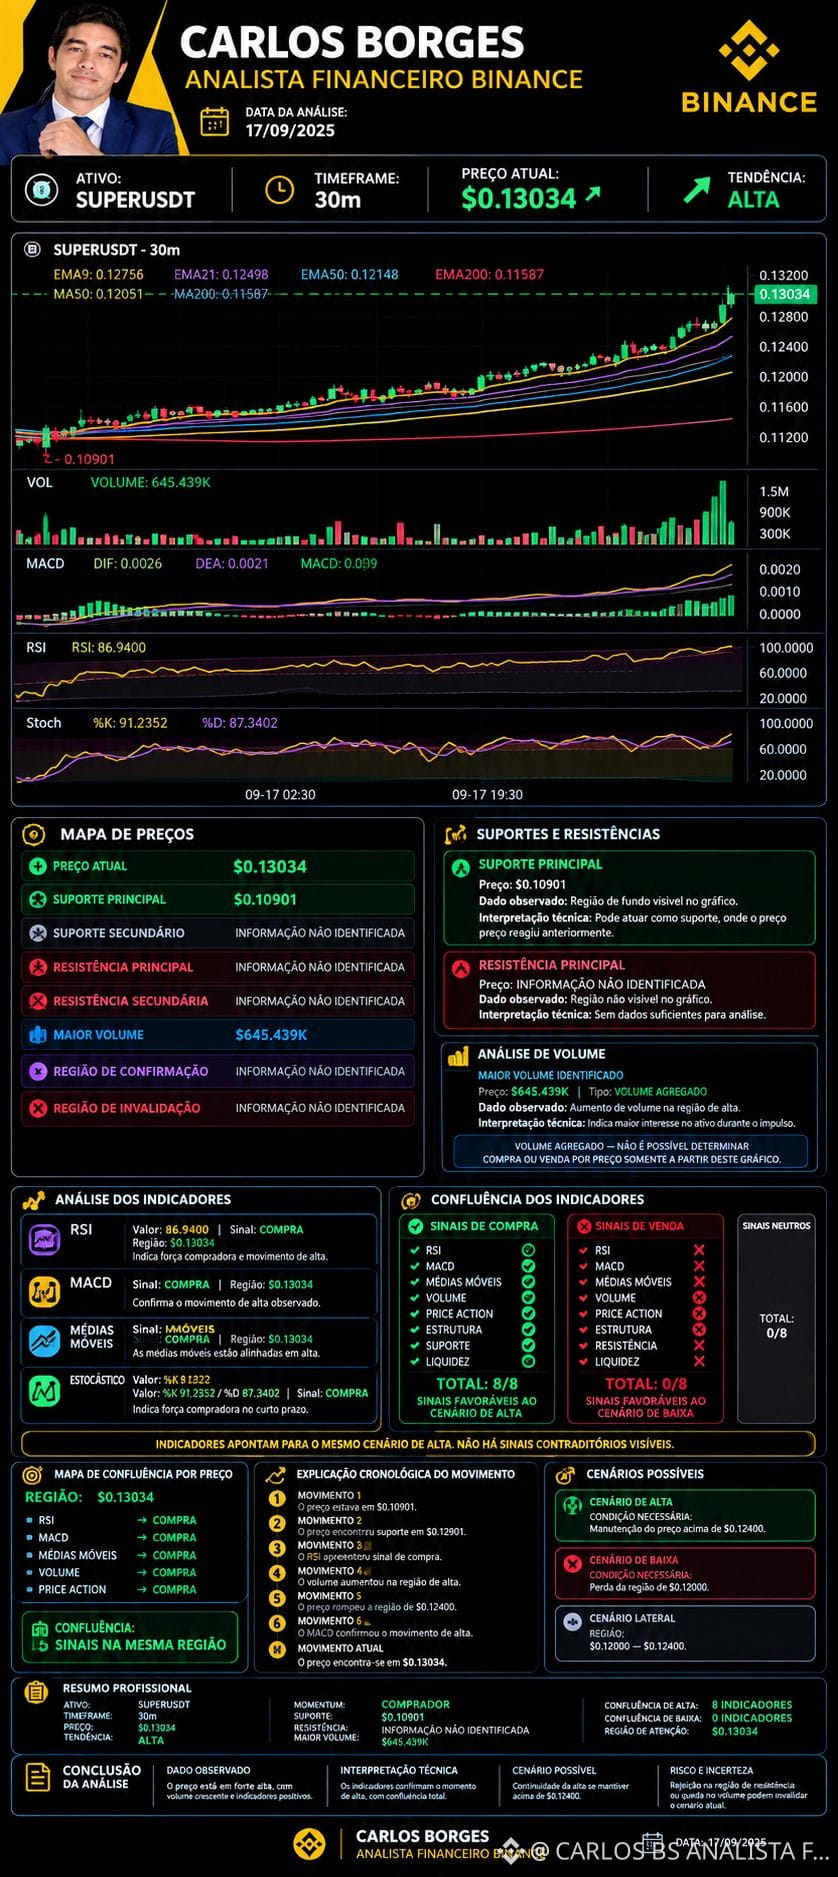
SUPERUSDT shows strong upward movement, with the price at $0.13034, above the visible moving averages. The RSI is 86.94 and the Stochastic is at %K 91.2352 / %D 87.3402, indicating a region of strong extension of the move.
📊 TECHNICAL INTERPRETATION:
Although the structure remains bullish, the oscillators are at elevated levels. The significant increase in volume on the last candles also deserves monitoring, since accelerated moves may show periods of profit-taking or correction.
⚠️ REVERSAL MONITORING:
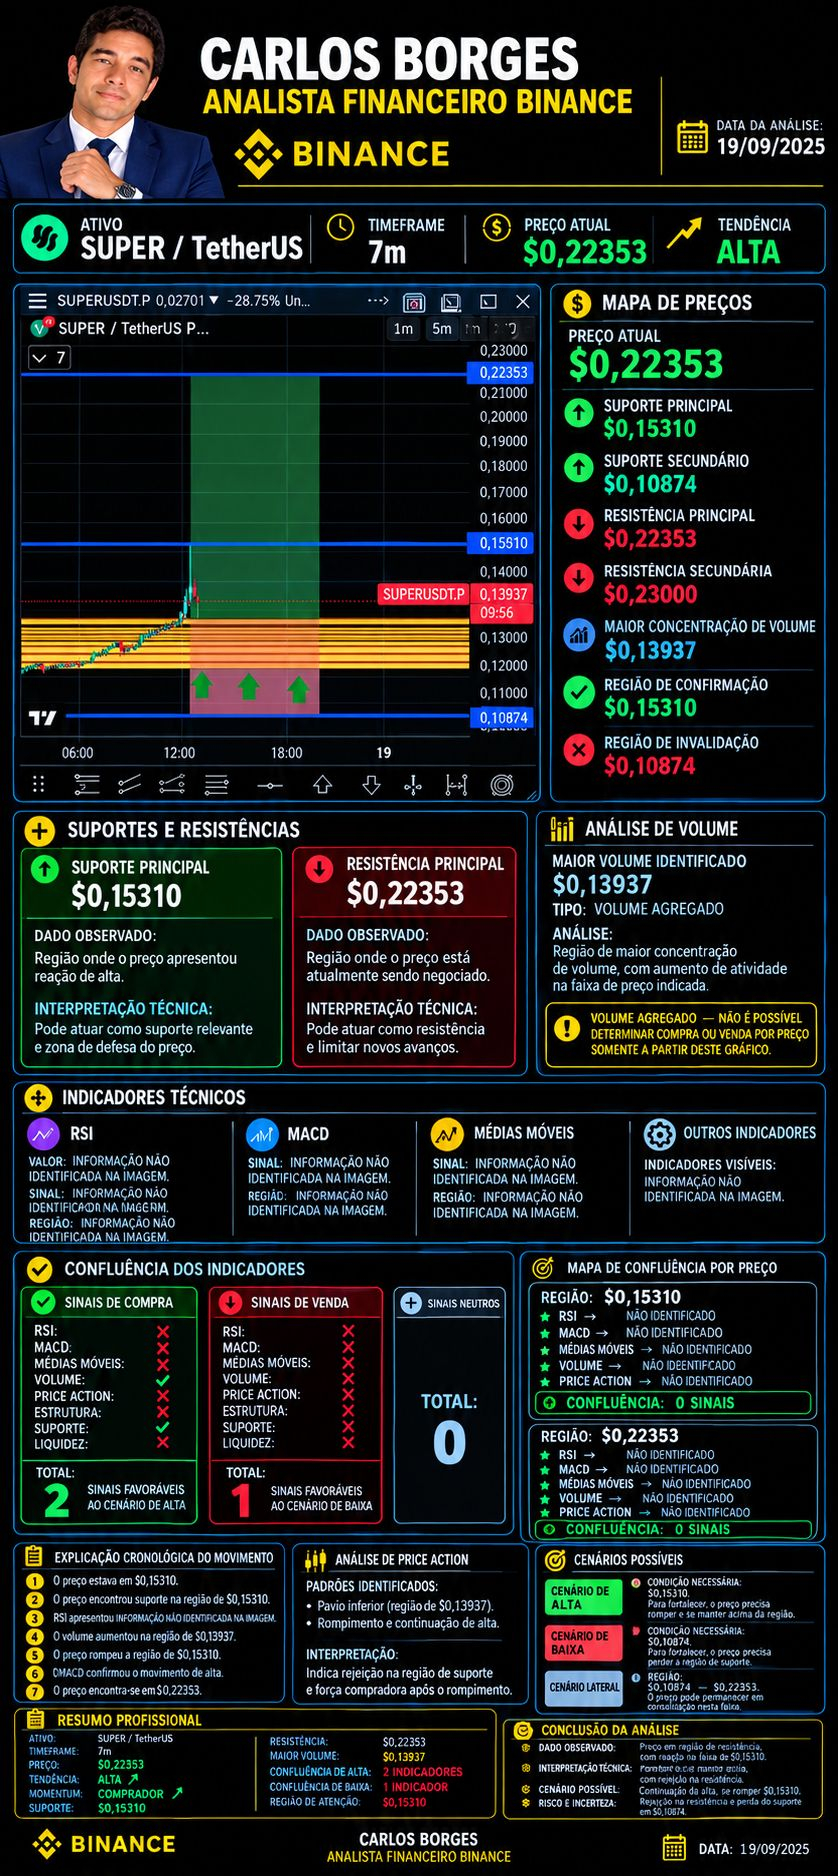
A possible reversal is not yet confirmed based solely on the image. The main point of attention is to see whether the price breaks the bullish structure, especially with closes below support regions and changes in the behavior of the MACD, moving averages, and volume.
🟢 SIGNALS THAT WOULD FAVOR CONTINUATION OF THE UPTREND
Price staying above the moving averages.
MACD remaining positive.
Volume sustaining the impulses.
An ascending structure of higher highs and higher lows.
🔴 SIGNALS THAT WOULD INCREASE ATTENTION FOR A REVERSAL
Clear rejection in the current region.
Loss of relevant support.
MACD weakening or crossing down.
RSI/Stoch leaving the elevated zone along with a drop in price.
Increase in volume during falling candles.
OBSERVED DATA:
SUPERUSDT shows strong upward movement, with the price at $0.13034, above the visible moving averages. The RSI is 86.94 and the Stochastic is at %K 91.2352 / %D 87.3402, indicating a region of strong extension of the move.
📊 TECHNICAL INTERPRETATION:
Although the structure remains bullish, the oscillators are at elevated levels. The significant increase in volume on the last candles also deserves monitoring, since accelerated moves may show periods of profit-taking or correction.
⚠️ REVERSAL MONITORING:
A possible reversal is not yet confirmed based solely on the image. The main point of attention is to see whether the price breaks the bullish structure, especially with closes below support regions and changes in the behavior of the MACD, moving averages, and volume.
🟢 SIGNALS THAT WOULD FAVOR CONTINUATION OF THE UPTREND
Price staying above the moving averages.
MACD remaining positive.
Volume sustaining the impulses.
An ascending structure of higher highs and higher lows.
🔴 SIGNALS THAT WOULD INCREASE ATTENTION FOR A REVERSAL
Clear rejection in the current region.
Loss of relevant support.
MACD weakening or crossing down.
RSI/Stoch leaving the elevated zone along with a drop in price.
Increase in volume during falling candles.