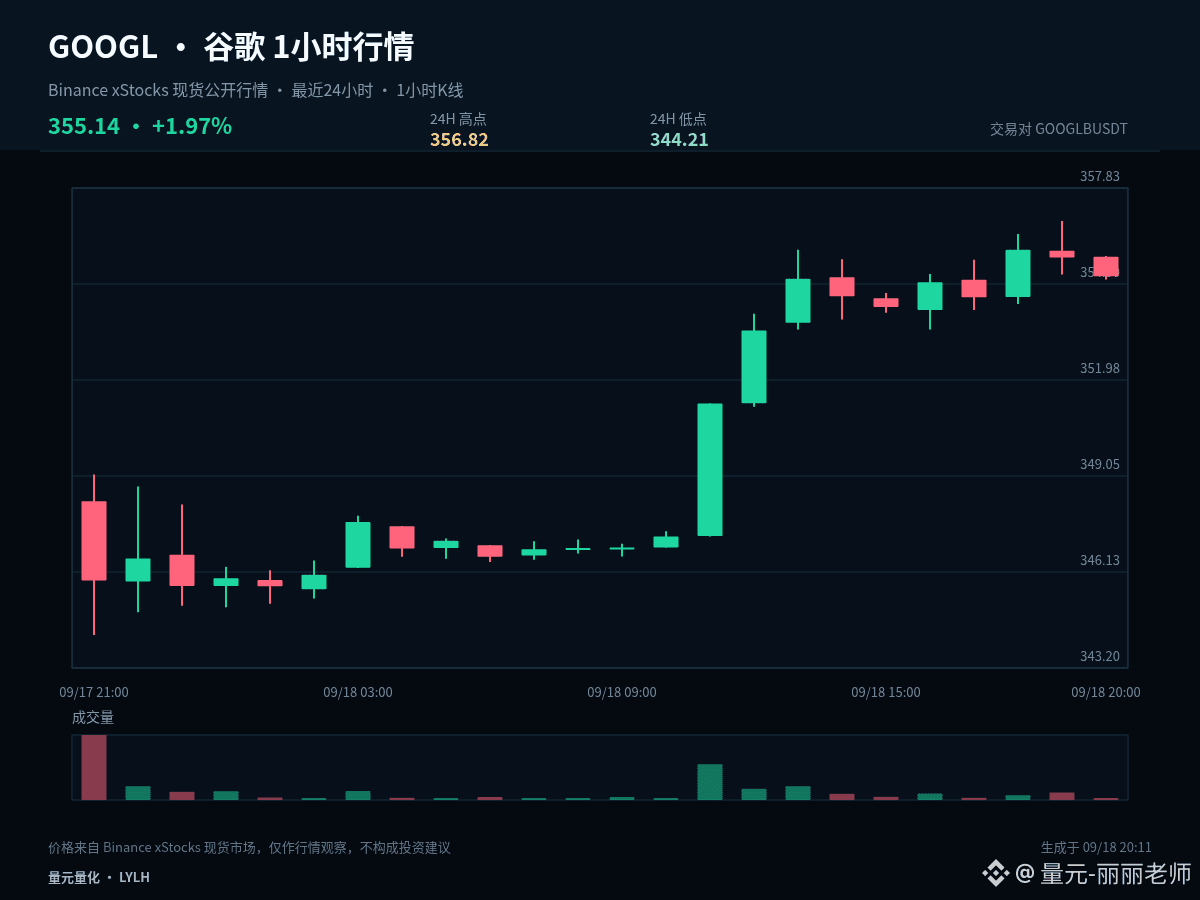
$GOOGLB #GOOGL It’s currently more like a range with turnover; there’s no need to interpret every 1-hour candlestick as a new trend. Current price: 355.14; 1 hour -0.16%, 24 hours +2.27%.
The current price is near the upper edge of the last 24-hour range: 1 hour -0.16%, 24 hours +2.27%. The most important thing at the highs is confirming acceptance after a breakout: if the price can stay above the upper edge, it shows the market is recognizing the higher range; if it only briefly pierces and then quickly snaps back, you need to guard against a false breakout.
Upper edge: 356.82, lower edge: 344.21, midline: 350.515. When price is near the upper edge, watch the breakout quality; near the lower edge, watch for follow-through/support. Around the midline, reduce frequent trading—since price is not far enough from either side, neither direction nor risk-reward is clear.
The signals truly worth acting on are: after a boundary break, the price is willing to remain in the new range; or after dipping to a boundary, it quickly reclaims it. Without such confirmation, continue to treat it as consolidation and don’t change the overall plan due to temporary intraday fluctuations.
Position management should distinguish between swing (medium/long-term) and short-term trades. If you already hold swing positions, first check whether the structure has been broken; don’t let repeated single 1-hour candlesticks sway you. For short-term positions, execute based on support/resistance and closing confirmation. If you’re in cash, there’s no need to chase price in the middle of the range—waiting for a clearer location is usually advantageous.
Risk control still comes before conclusions: execute only when conditions are met, and reassess promptly if the price becomes invalid. The higher the volatility, the more restrained each position size should be. The above is a projection based on the current 1-hour and 24-hour data, and it does not constitute a promise of returns.
#HKMAPlansWholesaleCBDCByYearEnd
The current price is near the upper edge of the last 24-hour range: 1 hour -0.16%, 24 hours +2.27%. The most important thing at the highs is confirming acceptance after a breakout: if the price can stay above the upper edge, it shows the market is recognizing the higher range; if it only briefly pierces and then quickly snaps back, you need to guard against a false breakout.
Upper edge: 356.82, lower edge: 344.21, midline: 350.515. When price is near the upper edge, watch the breakout quality; near the lower edge, watch for follow-through/support. Around the midline, reduce frequent trading—since price is not far enough from either side, neither direction nor risk-reward is clear.
The signals truly worth acting on are: after a boundary break, the price is willing to remain in the new range; or after dipping to a boundary, it quickly reclaims it. Without such confirmation, continue to treat it as consolidation and don’t change the overall plan due to temporary intraday fluctuations.
Position management should distinguish between swing (medium/long-term) and short-term trades. If you already hold swing positions, first check whether the structure has been broken; don’t let repeated single 1-hour candlesticks sway you. For short-term positions, execute based on support/resistance and closing confirmation. If you’re in cash, there’s no need to chase price in the middle of the range—waiting for a clearer location is usually advantageous.
Risk control still comes before conclusions: execute only when conditions are met, and reassess promptly if the price becomes invalid. The higher the volatility, the more restrained each position size should be. The above is a projection based on the current 1-hour and 24-hour data, and it does not constitute a promise of returns.
#HKMAPlansWholesaleCBDCByYearEnd