
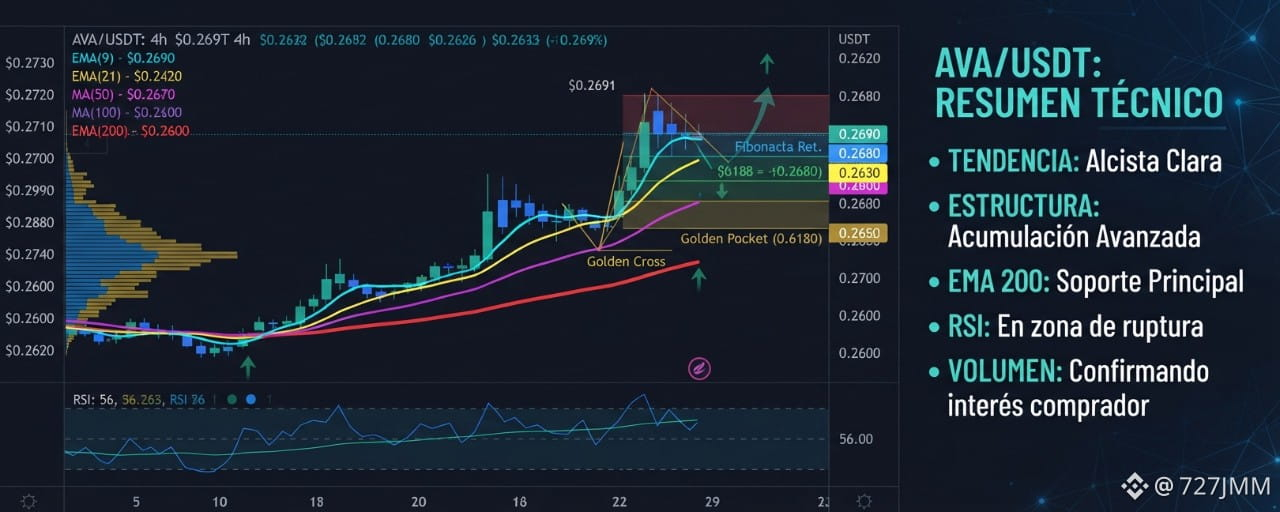


AVA/USDT across 1h, 4h and Daily timeframes. Currently trading at $0.2691, the asset is in a key compression zone where institutional hands are positioning themselves ahead of the next bullish impulse. Let's break it down technically.
Situation Analysis
Market Structure: We are in a clear accumulation phase following a flawless retest of the macro support.
EMA and MA: On 4h charts, the EMA 9 and EMA 21 show a bullish crossover (Golden Cross) above the MA 50, while on the Daily chart the price firmly respects the EMA 200, validating the strength of the main trend.
RSI and Volume: The RSI stands at 56 points on the 4h timeframe with a positive slope, coming out of the consolidation zone, supported by a gradual increase in trading volume.
Trade Setup (Professional)
Ideal Entry Zone: $0.2650 - $0.2720 (Current consolidation range).
TP1 (Conservative): $0.2950 (First key technical resistance).
TP2 (Intermediate): $0.3300 (Liquidity target at monthly resistance).
TP3 (Moonshot): $0.3850+ (Extended projection based on Fibonacci expansion).
Stop Loss (SL): $0.2520 (Technical invalidation below the structural support).
Trading Range and Rationale
We enter this position by taking advantage of a technical bounce at the Fibonacci 0.618 level, supported by the confluence of the 21 EMA on 4h and an RSI crossing upward through the mid level with volume confirmation.