Today I saw a piece of news.
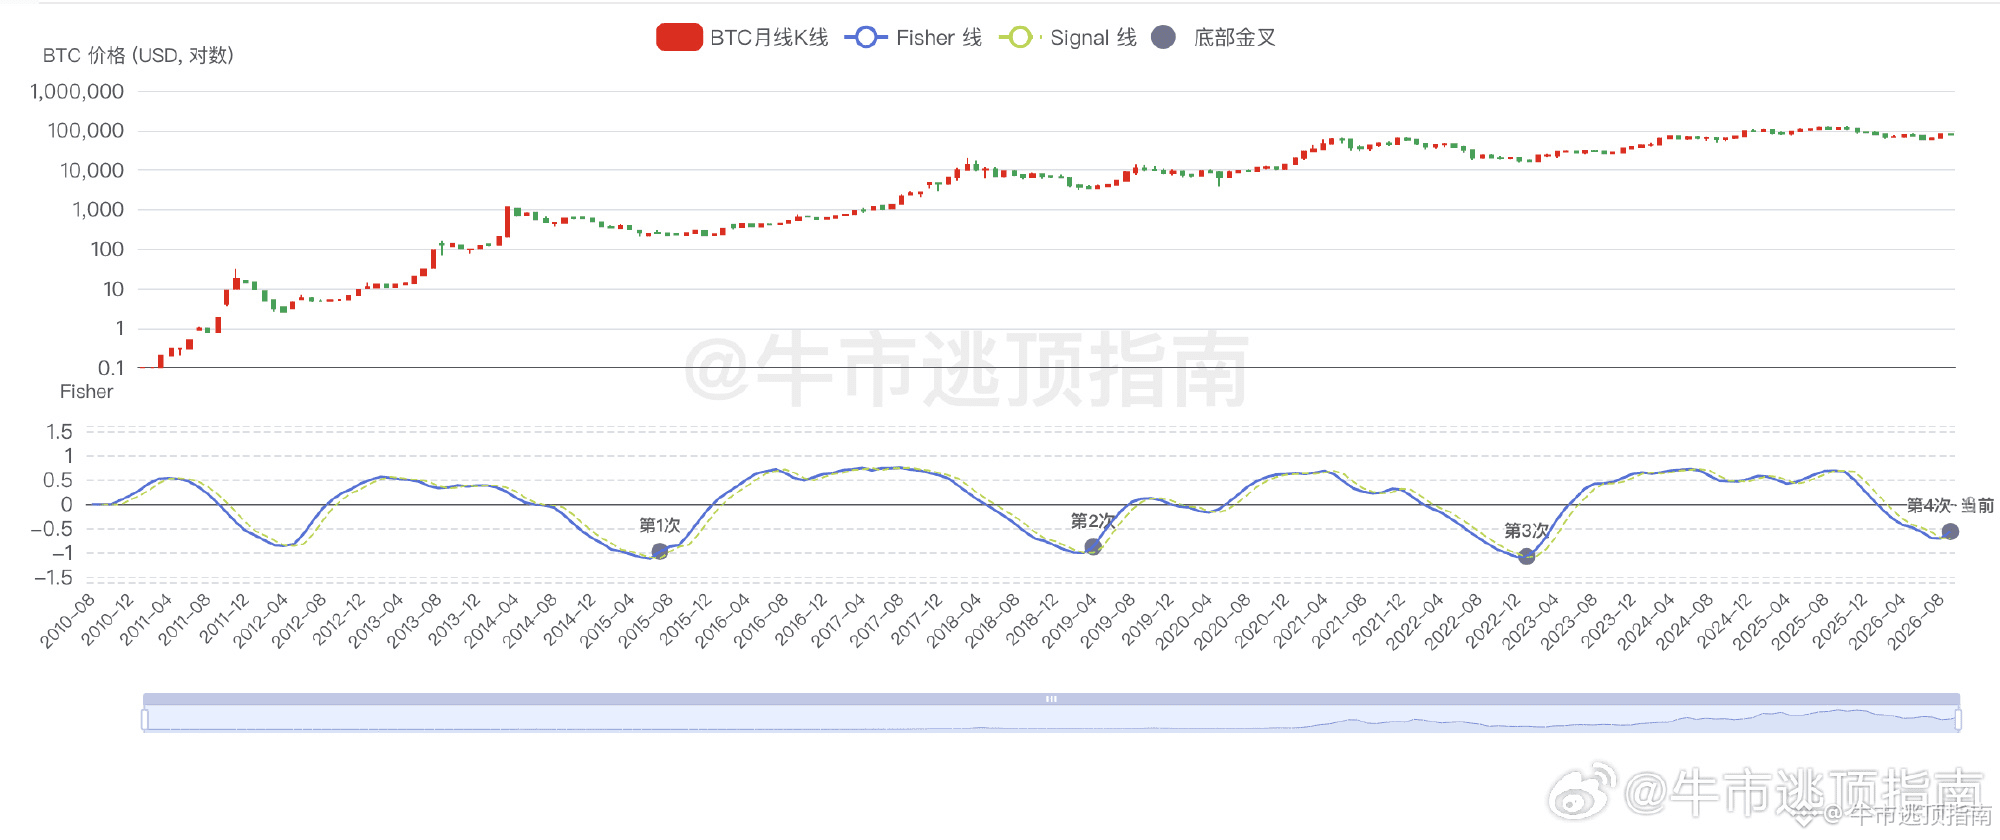
Willy Woo used the Fisher Transform indicator to analyze the monthly chart of BTC. He pointed out that the current golden cross under this indicator is the 4th bottom signal in history. The first 3 times did not involve a false breakout.
- The 1st time was 2015-07, when BTC was about $288;
- The 2nd time was 2019-04, about $5,321;
- The 3rd time was 2023-01, about $23,125;
- The 4th time is 2026-09, about $78,034.
There’s a very clear pattern across these instances. In fact, they mostly didn’t form the crossover exactly at the lowest point. Instead, the signal was confirmed just a little to the right of the bottom.
Also, the data used here isn’t daily or weekly—it’s based on a higher timeframe monthly chart. Monthly charts are generally considered more accurate for judging larger trends.
My simple, plain-language explanation of this indicator is: the Fisher Transform is basically a “panic meter.” Only when it drops to the extreme and then turns upward does it indicate that the most pessimistic period has passed.
Brothers, do you think this fourth bottom signal can accurately predict again?