🚀 XRP REGAINS MOMENTUM: HEADING FOR NEW MOVES OR CONSOLIDATION? ⚡
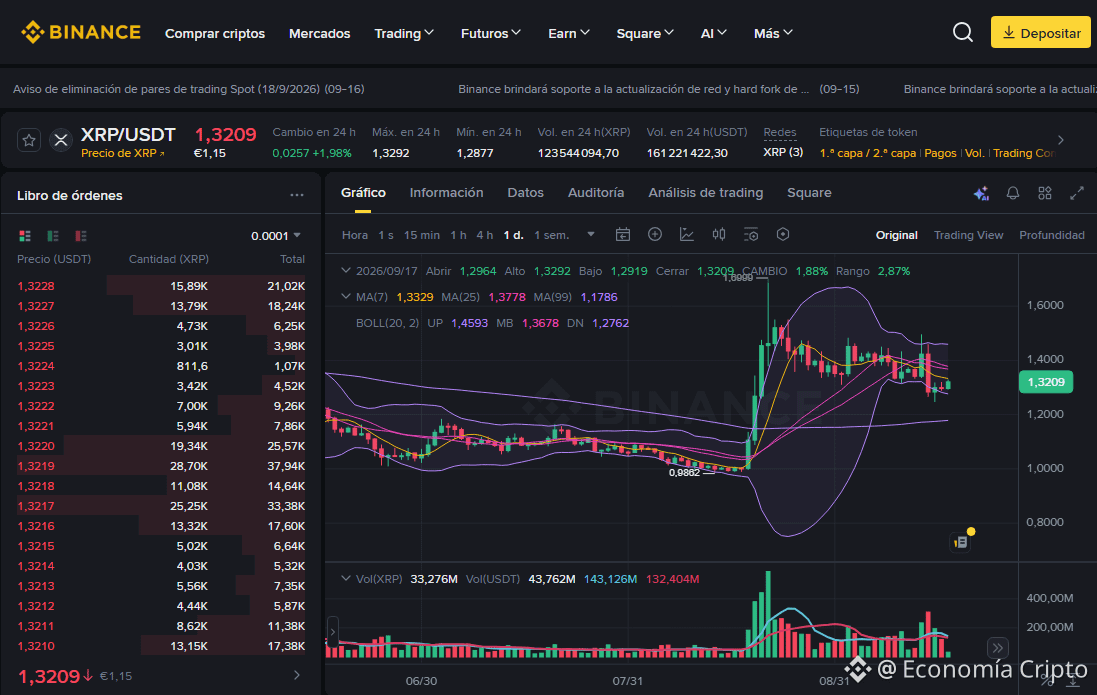
The XRP/USDT pair is trading at 1.3209, recording a +1.98% gain over the last 24 hours. The daily session shows an open at 1.2964, a high of 1.3292, a low of 1.2919, and a +1.88% increase, reflecting the return of buying pressure in the market.
🔍 Trend Analysis and Indicators
Trend: Bullish short-term recovery, looking to stabilize and break above key operating control zones after the prior corrections.
Moving Averages: Price is approaching the MA(7) (1.3329) and is trading below the MA(25) (1.3778), while the broader macro structure remains firmly supported, as it is trading well above the MA(99) (1.1786).
Bollinger Bands: Price bounces from the lower zone and is moving toward the middle band MB (1.3678), with the upper band UP (1.4593) and the lower band DN (1.2762), indicating a decrease in bearish volatility and greater buying interest.
Key Levels: Immediate support is consolidating in the 1.27–1.29 area, while the main resistance to challenge lies at the 25-period moving average and the middle band.
💡 Trading Strategy: Buy or Sell?
Buy (Long)?: Support defense and the technical bounce support tactical entry opportunities, aiming for a move toward the Bollinger middle band, always using strict risk management and a Stop Loss placed below the session’s low.
Sell (Short)?: Selling lower has a low probability due to the strength of the underlying bullish trend; it would only be considered if there is a clear rejection in the resistance zone.
#XRP #AnalisisTecnico #CryptoTrading
May the Lord bless and prosper the one who trades here, in the name of Jesus, because your word says: “Mine is the silver, and mine is the gold,” says the LORD of hosts. Hageo 2:8 RV1960-T -
$XRP
The XRP/USDT pair is trading at 1.3209, recording a +1.98% gain over the last 24 hours. The daily session shows an open at 1.2964, a high of 1.3292, a low of 1.2919, and a +1.88% increase, reflecting the return of buying pressure in the market.
🔍 Trend Analysis and Indicators
Trend: Bullish short-term recovery, looking to stabilize and break above key operating control zones after the prior corrections.
Moving Averages: Price is approaching the MA(7) (1.3329) and is trading below the MA(25) (1.3778), while the broader macro structure remains firmly supported, as it is trading well above the MA(99) (1.1786).
Bollinger Bands: Price bounces from the lower zone and is moving toward the middle band MB (1.3678), with the upper band UP (1.4593) and the lower band DN (1.2762), indicating a decrease in bearish volatility and greater buying interest.
Key Levels: Immediate support is consolidating in the 1.27–1.29 area, while the main resistance to challenge lies at the 25-period moving average and the middle band.
💡 Trading Strategy: Buy or Sell?
Buy (Long)?: Support defense and the technical bounce support tactical entry opportunities, aiming for a move toward the Bollinger middle band, always using strict risk management and a Stop Loss placed below the session’s low.
Sell (Short)?: Selling lower has a low probability due to the strength of the underlying bullish trend; it would only be considered if there is a clear rejection in the resistance zone.
#XRP #AnalisisTecnico #CryptoTrading
May the Lord bless and prosper the one who trades here, in the name of Jesus, because your word says: “Mine is the silver, and mine is the gold,” says the LORD of hosts. Hageo 2:8 RV1960-T -
$XRP