🚀 Ethereum regains momentum: heading for new phases or consolidation? ⚡
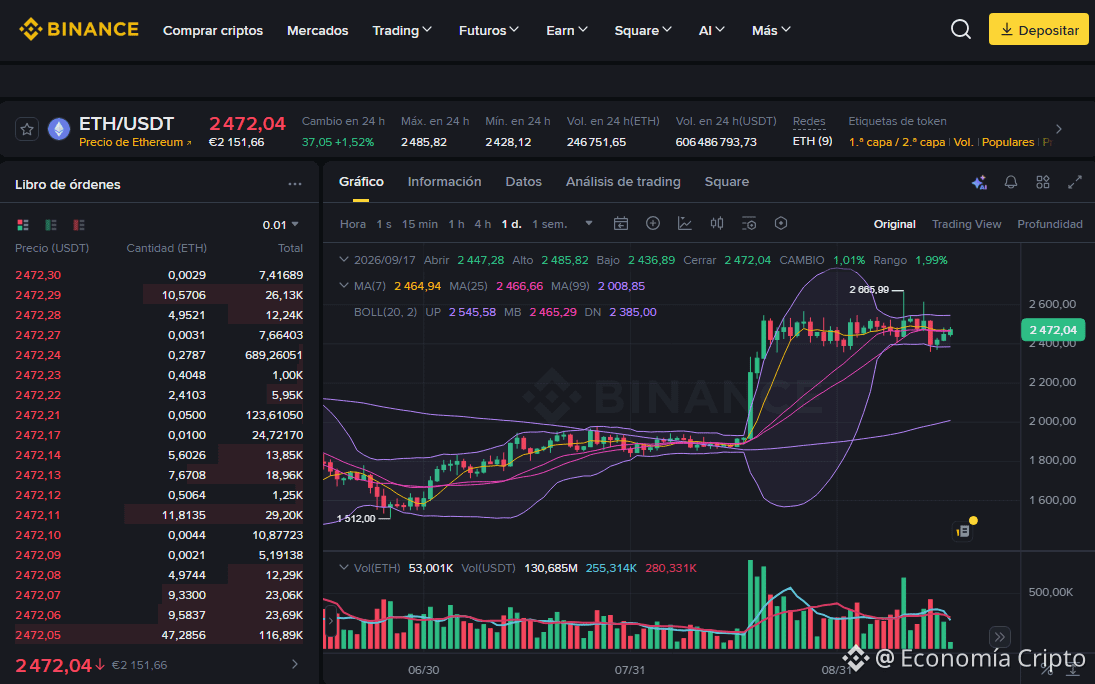
The ETH/USDT pair is trading at 2,472.04, recording a gain of +1.52% over the last 24 hours. The daily session shows an open at 2,447.28, a high of 2,485.82, a low of 2,428.12, and an increase of +1.01%, reflecting the return of buying pressure in the market.
🔍 Trend Analysis and Indicators
Trend: Bullish short-term recovery, consolidating positions above the operational control zones.
Moving Averages: Price is above the MA(7) (2,464.94) and touches the MA(25) (2,466.66), while the broader macro structure remains firmly bullish as it trades well above the MA(99) (2,008.85).
Bollinger Bands: Price is oscillating near the middle band MB (2,465.29), with the upper band UP (2,545.58) and the lower band DN (2,385.00), indicating temporary equilibrium and a favorable bias to seek the upper part of the channel.
Key Levels: Immediate support is consolidating in the 2,428 area, while the main resistance to challenge is located near the previous highs at 2,665.99.
💡 Trading Strategy: Buy or Sell?
Buy (Long)?: A break above the fast moving averages supports tactical entry opportunities to seek an upward push toward the upper band, always using strict risk management and a Stop Loss adjusted below the session low.
Sell (Short)?: Shorting has low probability due to the strength of the underlying bullish trend; it would only be considered in case of a clear rejection in the resistance zone.
#Ethereum #AnalisisTecnico #CryptoTrading
May the Lord bless and prosper those who operate here, in the name of Jesus, because your word says: "Mine is the silver, and mine is the gold," says the LORD of hosts. Hageo 2:8 RV1960-T -
$ETH
The ETH/USDT pair is trading at 2,472.04, recording a gain of +1.52% over the last 24 hours. The daily session shows an open at 2,447.28, a high of 2,485.82, a low of 2,428.12, and an increase of +1.01%, reflecting the return of buying pressure in the market.
🔍 Trend Analysis and Indicators
Trend: Bullish short-term recovery, consolidating positions above the operational control zones.
Moving Averages: Price is above the MA(7) (2,464.94) and touches the MA(25) (2,466.66), while the broader macro structure remains firmly bullish as it trades well above the MA(99) (2,008.85).
Bollinger Bands: Price is oscillating near the middle band MB (2,465.29), with the upper band UP (2,545.58) and the lower band DN (2,385.00), indicating temporary equilibrium and a favorable bias to seek the upper part of the channel.
Key Levels: Immediate support is consolidating in the 2,428 area, while the main resistance to challenge is located near the previous highs at 2,665.99.
💡 Trading Strategy: Buy or Sell?
Buy (Long)?: A break above the fast moving averages supports tactical entry opportunities to seek an upward push toward the upper band, always using strict risk management and a Stop Loss adjusted below the session low.
Sell (Short)?: Shorting has low probability due to the strength of the underlying bullish trend; it would only be considered in case of a clear rejection in the resistance zone.
#Ethereum #AnalisisTecnico #CryptoTrading
May the Lord bless and prosper those who operate here, in the name of Jesus, because your word says: "Mine is the silver, and mine is the gold," says the LORD of hosts. Hageo 2:8 RV1960-T -
$ETH