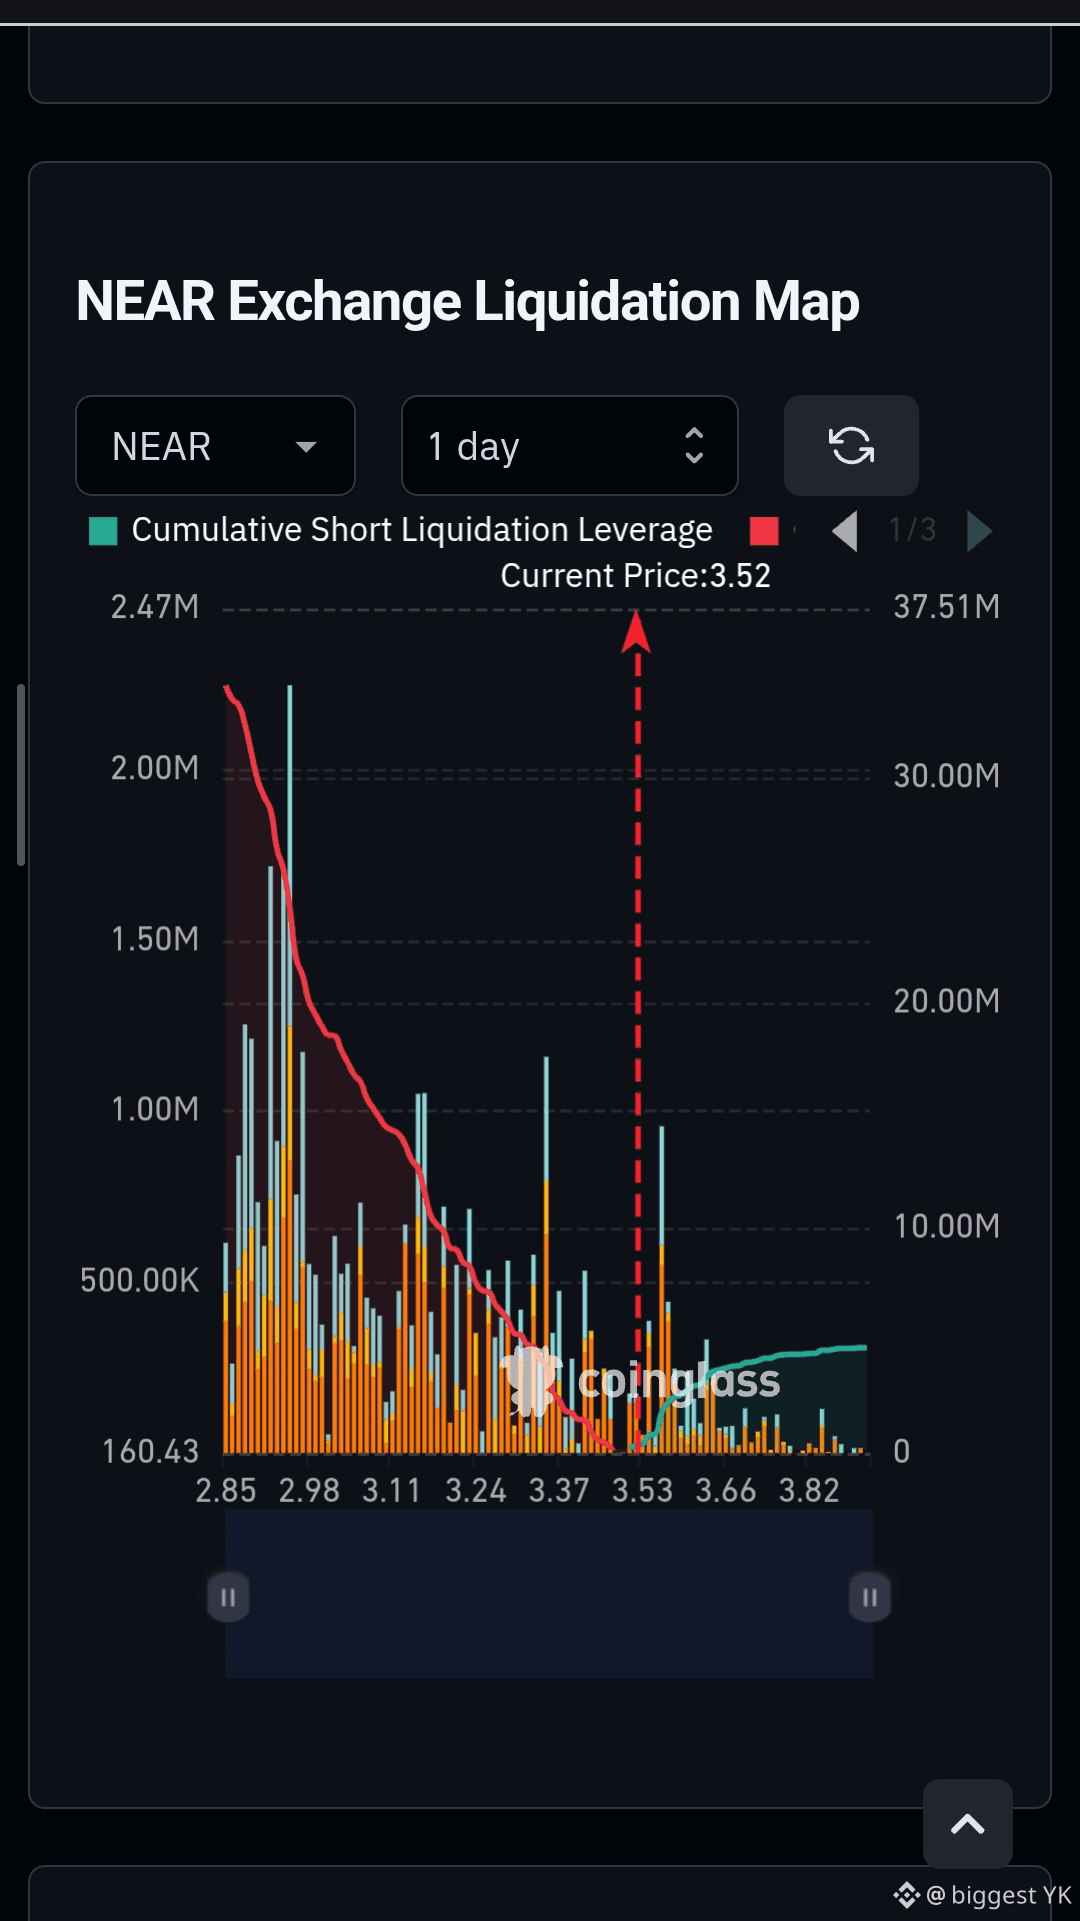
🚨 $NEAR HAS OVER $30M OF ESTIMATED LONG LIQUIDATIONS BELOW
CoinGlass’ 1-day liquidation map shows $NEAR around $3.52.
The imbalance is much bigger here:
🔴 Below price: roughly $30M+ in estimated long-liquidation liquidity.
🟢 Above price: roughly $4M in estimated short-liquidation liquidity.
That means a large amount of leveraged long positions is sitting below the current price.
If NEAR falls into those zones, forced liquidations could add selling pressure and make the move sharper.
But a move higher could trigger short liquidations and create a squeeze.
⚠️ These are estimated liquidation zones—not guaranteed targets or actual liquidation orders.
$30M+ below. $4M above. Which side gets hit first? 👀
$NEAR
CoinGlass’ 1-day liquidation map shows $NEAR around $3.52.
The imbalance is much bigger here:
🔴 Below price: roughly $30M+ in estimated long-liquidation liquidity.
🟢 Above price: roughly $4M in estimated short-liquidation liquidity.
That means a large amount of leveraged long positions is sitting below the current price.
If NEAR falls into those zones, forced liquidations could add selling pressure and make the move sharper.
But a move higher could trigger short liquidations and create a squeeze.
⚠️ These are estimated liquidation zones—not guaranteed targets or actual liquidation orders.
$30M+ below. $4M above. Which side gets hit first? 👀
$NEAR